|
The USD/JPY exchange rate tumbled 1.31% on Monday, to an intraday low of 118.71 yen per dollar, after the People’s Bank of China (PBoC) set the daily reference at 6.5032 yuan to the dollar, the weakest since May 24, 2011, according to the PBoC’s China Foreign Exchange Trade System. The offshore yuan (CNH) traded in Hong Kong, fell 1% to a five-year low of 6.6348. The spread between the onshore (CNY) and offshore yuan spot surged as high as 13 basis points, which might also have triggered capital outflows, meaning sell or short the yuan denominated assets and rotate into dollar assets, or safe-haven currencies such as the Japanese yen.
According to Reuters, the PBoC had temporarily suspended at least three foreign banks last week from conducting some of their foreign exchange (FX) business until the end of March. The restriction, primarily banning the settlement of yuan-related transactions of offshore clients in the domestic market, was supposed to curb the widening spread between the onshore and offshore exchange rates of the yuan.
The recent move by the PBoC to adjust the daily reference was in response to the December Caixin China Purchasing Managers’ Index (PMI) for the manufacturing sector. The weaker than expected reading fell to 48.2 and missed the Reuters poll forecast for 49.0, contracting for the 10th straight month, as a number below 50 indicates contraction in the manufacturing sector.
The Chinese economy is slowly transitioning from export-oriented manufacturing to a consumer-driven economy. The National Bureau of Statistics of China reported earlier last month that China’s total retail sales of consumer goods rose a better-than-expected 11.2% year-over-year, to 2.8 trillion yuan in November, and an improvement from October’s rise of 11.0%.
Chinese government officials announced late last month, at the close of a key meeting of China's Communist leadership, a series of reforms to steer the country’s economy away from a hard-landing scenario, including plans to make China's monetary policy more flexible and to expand the government's budget deficit next year. Analysts believe that the raft of measures will provide support to a slowdown in the home building sector in China.
The recent economic readings from the U.S. and Japan have been a mixed bag. The U.S. Institute for Supply Management (ISM) said on Monday that its index of national factory activity for December fell to 48.2, the lowest level since June 2009, from 48.6 in November. The reading was just below expectations of 49 from a Reuters poll of 80 economists. The U.S. Commerce Department also said on Monday that construction spending slipped 0.4%, the first and biggest drop since June 2014, missing economists’ forecast of a 0.6% rise.
Weak construction spending and ISM figures prompted the Federal Reserve Bank of Atlanta to lower the U.S. GDP growth forecast in the fourth-quarter of 2015 to 0.7% on Monday, down from 1.3% forecasted on December 23.
The Ministry of Economy Trade & Industry of Japan said last Monday that industrial production in Japan dropped 1% in November from October, compared to the forecast for a 0.5% drop. On a year-on-year basis, the output was up 1.6%, after 3 straight months of declines. The trade ministry also said that retail sales declined 2.5% from October, citing sluggish sales of winter clothing due to relatively warm weather and a drop in fuel sales, reflecting lower gasoline prices.
As of December 22, there were 83,156 short positions of Japanese yen, traded on the Chicago Mercantile Exchange (CME) in units of 12,500,000 Japanese yen, by leveraged funds, an increase of 1,209 contracts from the previous week, according to the Commitment of Traders (COT) data released by the Commodity Futures Trading Commission (CFTC). This is compared to about 25,084 long positions, a decrease of 1,020 contracts during the same period. The net short positions increased by 2,229 contracts, worth about 27.86 billion yen.
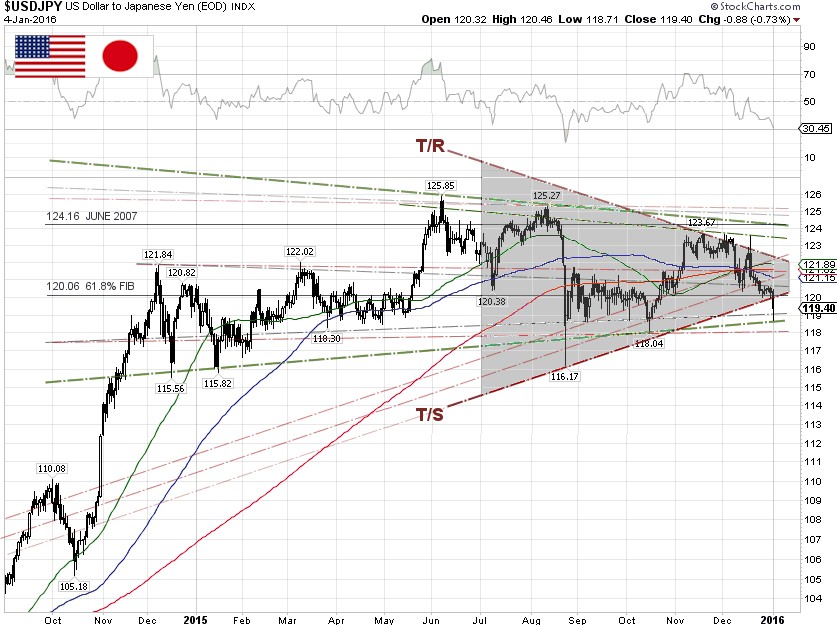
From our technical viewpoint, the USD/JPY has been moving in a symmetrical triangle chart pattern since December 2014, a narrow trading band between 118 yen per dollar and 125 yen per dollar, as traders can’t decide in which direction the Japanese yen would move next. The currency pair just broke down below the trendline resistance (T/S) and is now building up momentum to the downside. |