|
The price of gold extended its losses another 2.4% on Thursday to close at U.S. $1258.70 per ounce, just above its 200-day moving average, as gold futures brokers began to realize a day after the Federal Open Market Committee (FOMC) meeting that the U.S. Federal Reserve’s statement was hawkish, rather than dovish.
The U.S. Dollar index (DXY) surged on Thursday to 95.00, near its 52-week high of 95.527. Gold is normally traded in an inverse correlation with the US dollar, meaning gold prices decline with a strengthening US dollar.
Since the beginning of the year, hedge funds have been making bullish gold bets, pushing their net long gold positions to levels not seen for almost two years. An attempt to drive gold prices higher during the past week has faced several key technical resistances at around US $1300 per ounce.
The recent pullback could be due to short-term profit-taking. Nonetheless, the decline could send the gold price back to retest the US $1240 or US $1200 per ounce support levels.
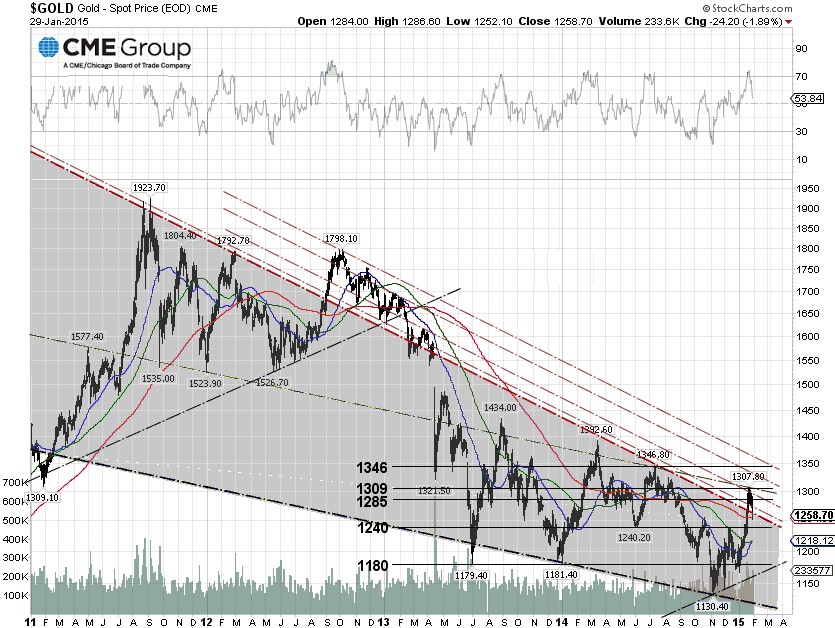
For the past four years, gold prices have been moving in a bullish falling wedge chart pattern since the price hit an all-time high of U.S. $1923.70 per ounce in September 2011. The failed attempt of a falling wedge breakout in late 2012, after the European debt crisis, resulted in gold prices taking a nosedive. |