|
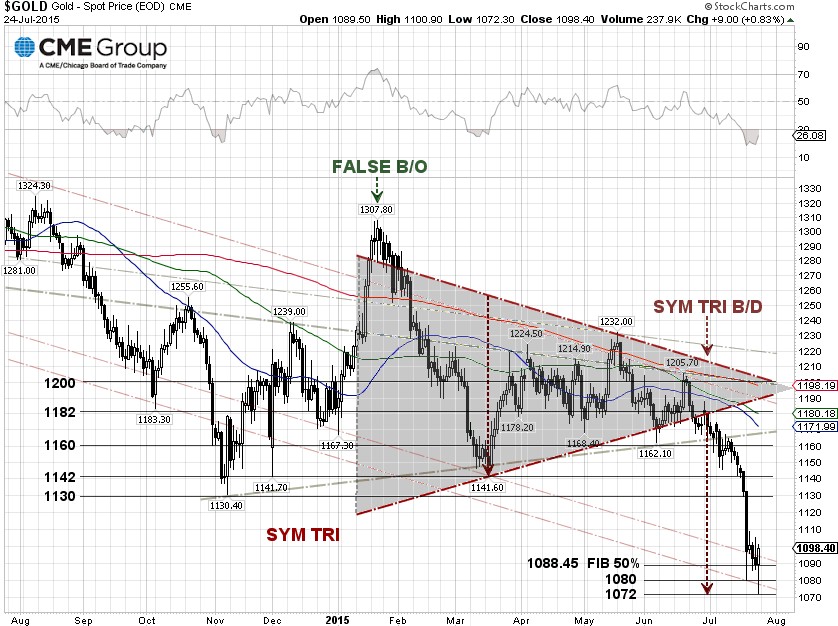
Gold took another dive on Friday but bounced off the U.S. $1,072 per ounce level to close at U.S. $1,098.40, just above the 50% Fibonacci retracement level. Last Monday, we suggested that the projected gold price is U.S. $1,072 per ounce, in the event of a symmetrical triangle breakdown.
From our technical viewpoint, the relative strength index (RSI) at 26.08 and the Moving Average Convergence/Divergence (MACD) at –22.141, points to extremely oversold conditions. As hedge funds are taking on more short positions, we might see the RSI and MACD as low as 15 and –50, respectively, before gold can make a meaningful rebound. The near-term support is U.S. $1,044.50 per ounce.
Hedge funds have been bearish on gold since mid-June. As of July 24, there are 159,441 short positions for gold futures [COMEX:GC], by non-commercial dealers, compared to about 143,190 short positions last week, according to the Commitment of Traders (COT) data released by the Commodity Futures Trading Commission (CFTC) each Friday. The long positions have decreased to 187,720 contracts from about 191,014 contracts last week, resulting in a gain of net short positions of 19,545 contracts for the week, worth about U.S. $2.1 billion, where gold contracts are traded in units of 100 troy ounces.
And here is how the gold rout got started. The CME spot price of gold tumbled 4.62% on Monday to an intraday low of U.S. $1,080 per ounce, or February 2010 resistance levels, following an overnight two-minute flash crash on the Shanghai Gold Exchange (SGE) and COMEX New York Mercantile Exchange (NYMEX). An estimated 33 tonnes of gold, worth about U.S. $1.3 billion, was traded during the two-minute period, Reuters said.
|