|
The price of gold has tumbled 2.28% since the beginning of the week to close on Thursday at U.S. $1,172.10 per ounce, as the yield of the U.S. 10-year Treasury notes surged 6.19% to 2.4% during the same time period. Investors were dumping U.S. Treasuries and gold as U.S. economic data came in better than expectations and the Greek debt drama still seems to have no end in sight.
The Bureau of Economic Analysis (BEA), U.S. Commerce Department, said on Wednesday that the final reading of the U.S. first-quarter gross domestic product (GDP) was revised to a contraction of 0.2% at an annual rate, versus a previous estimated decline of 0.7%. The revision, in line with forecasts, was made as exports dropped less than previously estimated as well as a bigger increase in consumer spending.
The BEA said on Thursday that U.S. consumer spending surged a seasonally adjusted 0.9% in May, beating economists’ forecast of a 0.7% rise. The May core PCE price index, excluding food and energy, came in at a 1.2% increase from a year ago, in line with analysts at Bank of America Merrill Lynch, but well below the Fed’s inflation target of 2.0%.
The price of gold has been running out of stream since mid-May as it was unable to break out the U.S. $1,224 per ounce resistance level, after a big surge on May 13 when gold broke through the key resistance of U.S. $1,200 per ounce. The gold sell-off could be attributed directly to a surge in the U.S. Treasury yields as the correlation between the two of them is high.
A lack of demand may be part of the falling gold price as the global gold jewelry demand for the first-quarter of 2015 declined 3% to 600.8 tons, according to the World Gold Council’s quarterly report.
As of June 16, there are 115,330 short positions for gold futures [COMEX:GC], by non-commercial dealers, compared to about 191,053 long positions, according to the Commitment of Traders (COT) data released by the Commodity Futures Trading Commission (CFTC) each Friday. Hedge funds and large speculators seemed to turn bearish in the previous week as the net short positions have increased 28,687 contracts, since June 2, where gold contracts are traded in units of 100 troy ounces.
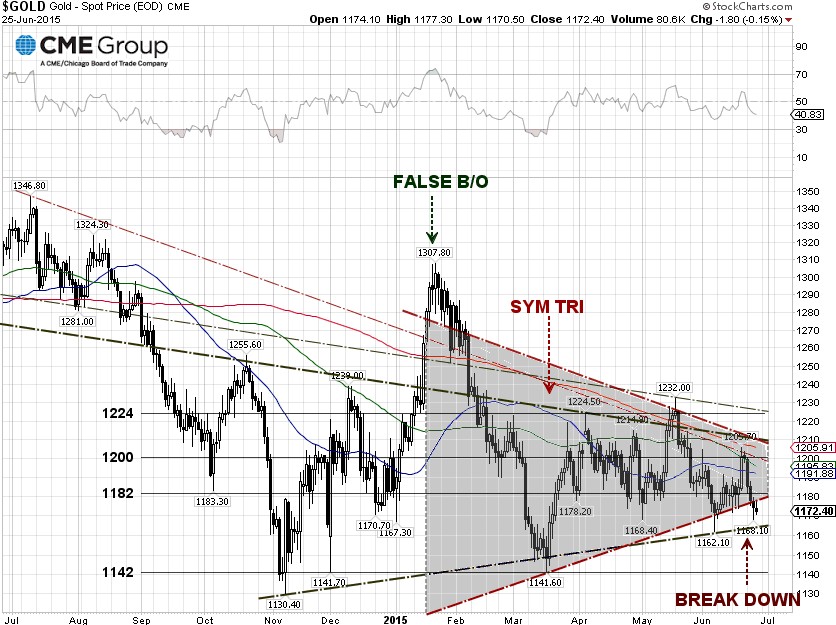
From our technical viewpoint, gold is moving in two symmetrical triangle chart patterns. On Wednesday, gold broke down the lower trendline support of a symmetrical triangle, at U.S. $1,176 per ounce. The near-term technical supports for gold are the trendline support at U.S. $1,164 per ounce and a baseline support at $1,142 per ounce. Gold could turn very bearish if the price breaks down through the $1,142 per ounce level.
The next move for gold prices could depend upon the yield of the U.S. 10-year Treasury note. Based upon our analysis, the technical head resistances for the 10-year yield are at 2.5% and 2.66%, or the 23.6% Fibonacci retracement level.
Here is what Barclays and UBS had to say about gold, according to the Bullion Desk. Barclays said that gold should increasingly face downward pressure as the summer is a seasonally slow period for demand. According to UBS, a near-term closing price below U.S. $1,170 could signal bearish technicals and a decline to U.S. $1,142.93, the low of March 17. It looks like both analyst firms are bearish on gold for the short-term.
|