|
Gold futures for delivery in April 15 [GCJ5] surged 2.34% on Wednesday to an intraday high of U.S. $1,175.10 per ounce on heavy volume and closed at U.S. $1,166.40 per ounce after the U.S. Federal Reserve concluded their 2-day Federal Open Market Committee (FOMC) meeting. The U.S. Dollar index (DXY), a weighted geometric index of the value of the U.S. dollar relative to a basket of 6 major currencies, tumbled 5.19% to an intraday low of 94.765 before bouncing back and closed at 98.781.
Currency speculators, who were piling their bullish bets on the dollar, decided to take profits and turned to the next momentum trade, such as gold and crude oil, as U.S. Federal Reserve Chair Janet Yellen said after the FOMC meeting, "Just because we removed the word patient from the (monetary) statement doesn't mean we are going to be impatient".
In contrast to crude oil prices, which are inversely correlated with the DXY, the surge in gold prices in the past 10 years were not necessarily associated with a weak U.S. dollar.
In the past 6 months, there were 3 major events that have driven gold prices higher while the DXY was either flat or on the rise. In October of last year, the gold price surged over 6% on the speculation that the India Commerce Ministry was about to reimpose some restrictions on gold imports, after Diwali, in order to push down the trade deficit.
From December to January, gold prices moved from the U.S. $1,180 per ounce level to the U.S. $1,302 per ounce level as Russia's central bank was trying to intervene to keep the ruble from tumbling and ramped up interest rates to 17%. The ruble crisis was followed by the announcement from the Swiss National Bank (SNB) in January that they would abandon their 3-year old peg at 1.20 Swiss francs per euro. The SNB announcement sent the gold prices skyrocketing 2.73% on that day, while the DXY still rose 0.31%.
As of March 17, there are 109,175 short positions for gold futures [GCJ], by swap dealers and managed money, compared to about 162,268 long positions, according to the Commitment of Traders (COT) data released by the Commodity Futures Trading Commission (CFTC) each Friday. The spread positions, the combination of both a long and a short position put on at the same time, stands at 46,560 contracts.
Hedge funds and large speculators seemed to turn slightly bearish as the long positions have dropped 9,553 contracts while the short positions have surged 19,246 contracts from last week, where gold contracts are traded in units of 100 troy ounces.
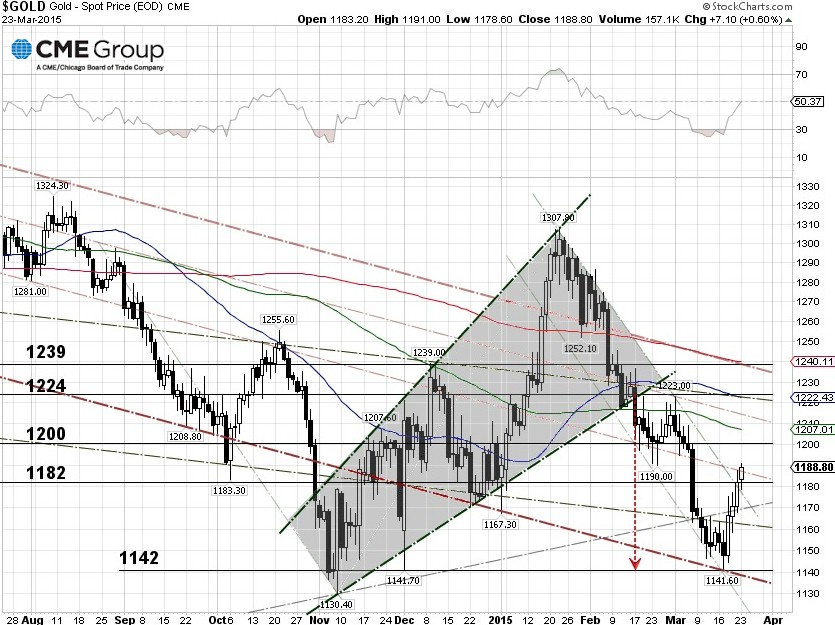
From a technical viewpoint, the gold price bounced off the base of the ascending wedge at U.S. $1,142 per ounce last Tuesday and has been on the rise since then. Gold closed on Monday at U.S. $1,188.80 per ounce, up about 4.1% since the bounce. If gold prices continue to climb, the head resistance is U.S. $1,200 per ounce.
It should be pointed out that the near-term technical supports for DXY are around 95 and 96.27, or 50% Fibonacci retracement. If the DXY bounces from these support levels, the hedge funds and large speculators may begin exiting their long positions of gold. The DXY closed on Monday at 97.30.
The headline risk for gold is the Q1 U.S. GDP estimate, to be released this Friday. The Wall Street Journal's survey-based estimate for Q1 GDP sees a 2.3% advance for this year's first three months.
Here is what UBS had to say about gold, just a week before the FOMC meeting. UBS thinks that within a 3-month time-frame, gold could come under pressure as market participants anticipate the first Fed rate hike. UBS revised its 1-month gold price target to U.S. $1,200 per ounce, from a previous U.S. $1,240, while the 3-month estimate was trimmed to U.S. $1,170 from U.S. $1,200. |