|
The CME spot price of gold broke down a key technical support at $1,160 per ounce, after the U.S. Federal Reserve decided to keep rates on hold and issued a somewhat hawkish policy statement after the two-day Federal Open Market Committee (FOMC) meeting on October 27 and 28. From the policy statement, the U.S. Federal Reserve hinted that they could be ready to raise interest rates at the next FOMC meeting on December 15-16, but they admit that the pace of job gains has slowed.
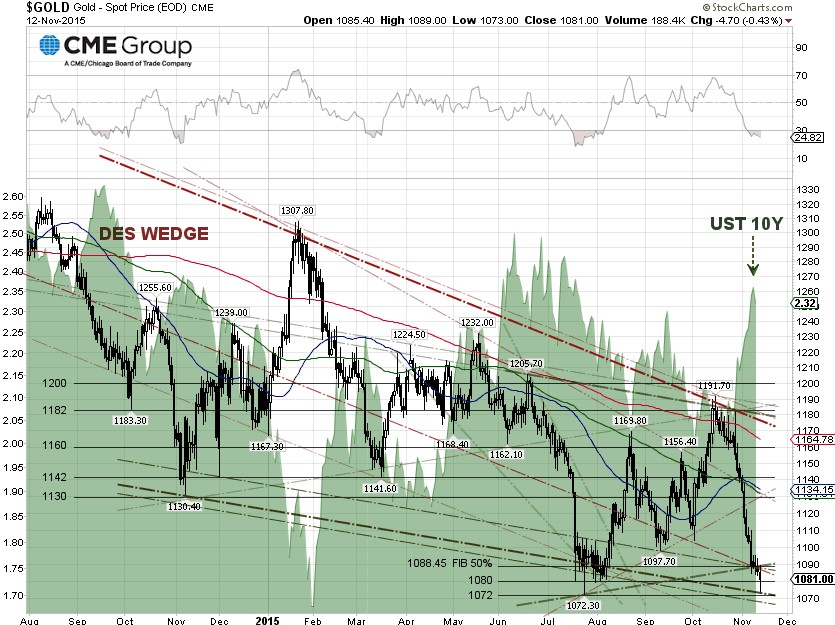
Last Friday, the gold price tumbled 1.28% to close at $1,088.90 per ounce when the U.S. Labor Department released the nonfarm payrolls report for October showing 271,000 jobs were added to the economy, while the U-3 headline unemployment rate dipped to 5.0%, from 5.1% in September. Wall Street economists were way off with their forecasts, as the consensus expectations were only for a 180,000 jobs gain with the unemployment rate remaining at 5.1%. Since then, gold has been trading around the key technical support of $1,088.45 per ounce, or the 50% Fibonacci retracement level.
Since October's FOMC meeting to date, the gold price has dropped 7.37% to close at $1,081 per ounce, while the yield of the U.S. 10-year Treasury notes has surged 12.93% to 2.315%, and the U.S. dollar index has jumped 2.08% to close at 99.013 on Thursday.
The gold market, in particular, is sensitive to variables such as monetary policy, macro-economic factors and physical supply and demand balances. The traditional view is that gold prices and interest rates have an inverse correlation as both move with inflation. As pointed out by Claude Erb, a former commodities portfolio manager at TCW Group, and his co-author Campbell Harvey, a Duke University finance professor, in an article published in Financial Analysts Journal in May 2013 entitled "The Golden Dilemma", gold and the 10-year treasury yield have an R-Squared of 0.78.
The value of R-Squared can range from 0 to 1.0. An R-Squared of 0.78 indicates that 78% of the variation in the gold prices is related to the variation in the yield of the 10-year U.S. Treasury Note, and 22% is not related.
As of November 3, there are 78,442 short positions for gold futures traded on the Commodity Exchange Inc. [COMEX:GC], by non-commercial dealers, compared to about 194,784 long positions, according to the Commitment of Traders (COT) data released by the Commodity Futures Trading Commission (CFTC) each Friday. The non-commercial dealers have decreased their long positions by about 31,201 contracts while they increased short positions by about 9,891 contracts from the previous week, resulting in a gain in the net short positions of 41,092 contracts, worth about $4.59 billion, where gold contracts are traded in units of 100 troy ounces.
|