|
The S&P 500 closed at 2,077.57 on Friday, down 1.25% for the week, as the U.S. economic data have been mixed and the earnings results from the U.S. corporation were tepid. The Wall Street Journal said that so far in the second-quarter for S&P 500 companies, U.S. corporate profit growth, if there is any, is at its weakest point since 2009. FactSet research expects U.S. corporate profits to contract 2.2% this quarter, after meager growth of 1.1% in the first-quarter. So it really shouldn’t be a surprise that the U.S. equity markets are volatile as the Federal Reserve is threatening a rate hike, which will put more pressure on corporate profits.
The Institute for Supply Management (ISM) released a survey Monday showing tepid growth in the U.S. manufacturing sector, as the ISM’s manufacturing purchasing managers index fell to 52.7% in July from 53.5% in June, missing the economists’ forecast of 53.7%. A reading above 50 indicates that the manufacturing economy is expanding.
The ISM's nonmanufacturing purchasing managers index, released Wednesday, faired much better as it rose to 60.3% in July from 56.0% in June, the highest level of growth for the nation's restaurants, builders, truckers and other service providers since the composite index's inception in January 2008. Wall Street economists had expected 56.2%.
The U.S. Department of Labor said on Friday that July non-farm payrolls came in with a 215,000 increase, down 11.52% year-on-year and below the Wall Street estimate of a 225,000 gain. The May and June numbers were revised up to 260,000 and 231,000, respectively, resulting in 14,000 more jobs gained during the periods.
The Department of Labor also said the July unemployment rate stood at 5.3% and more than 144,000 people left the labor force, pushing the labor force participation rate to a 38-year low at 62.6%, meaning a record 93.8 million Americans, 16 years and older, did not have a job and were not actively trying to find one. Although the labor force participation rate seemed to stabilize at 62.6% in June and July, the troubling part is that more than half a million people left the labor force during that period.
Wall Street economists said the July jobs report won’t stop the Federal Reserve from raising interest rates in September, as the Federal Reserve already made up their mind after the FOMC meeting on July 29, that it will hike the rate sooner rather than later this year. Bloomberg said the futures market is now pricing in an up-to-75% probability that the Federal Reserve will raise interest rates at the September 16-17 meeting.
Investors rotated out of the shorter-dated U.S. Treasury bonds, whose yields are highly sensitive to changes in the Federal Reserve’s rate-policy outlook, into longer-dated Treasury bonds in anticipation of the Federal Reserve’s rate hike in September. The short-term U.S. Government debt sell-off sent the yield of the U.S. 2-Year Treasury Note surging 1.68% to close at 0.721% on Friday, while the U.S. 10-Year Treasury Note yield was down 3.05% to close at 2.166%, or at 100-day SMA. Demand for the U.S. 10-Year Treasury Note could also rise as they are considered safe-haven assets in times of wobbly equity markets.
The best performing S&P 500 sectors for the week were Utilities, Financials and Consumer Staples. S&P 500 Utilities was up 0.83%, as investors rotated money out of high risk sectors into safe havens. The S&P 500 Financials sector was down just 0.13%, as investors believe that the Fed rate hike will boost bank profits. The worst performing sector for the week was Energy, down 3.02%. The energy sector trades along with the WTI crude oil price, which was down 6.46% for the week.
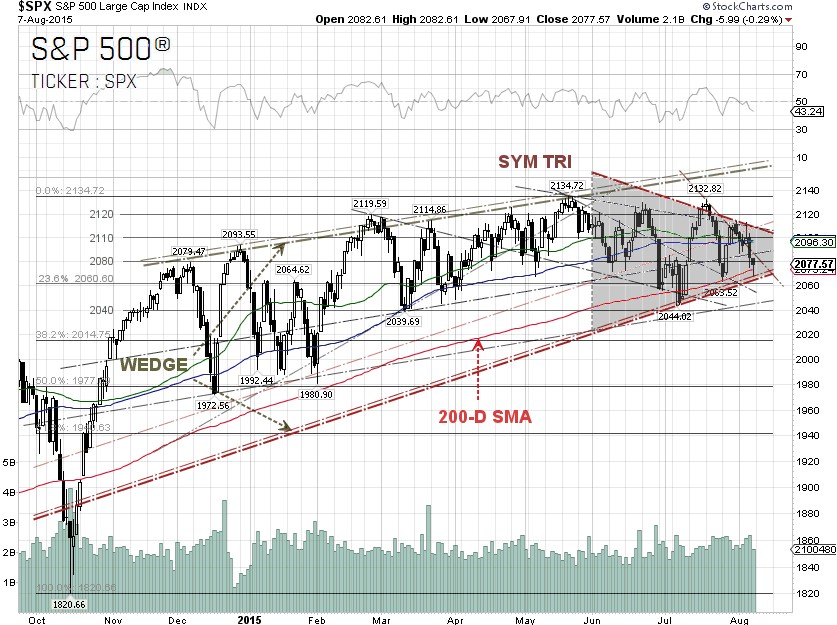
From our technical viewpoint, the S&P 500 bounced off the lower trendline support of the symmetrical triangle after a weak performance this week. The corporate profits have been tepid and there is not much upward momentum to push the index higher. If the trendline support can’t hold, there are technical supports at 2,040 and 2,014.75, or the 38.2% Fibonacci retracement level. Again, it is August and the market is typically volatile due to poor liquidity.
S&P 500 Summary: +0.91% YTD as of 08/07/15
Barclay Hedge Fund Index: +3.71% YTD
Outperforming Sectors: Healthcare +9.83% YTD, Consumer discretionary +8.33% YTD, Consumer staples +2.88% YTD, Information technology +1.72% YTD and Financials +1.53% YTD.
Underperforming Sectors: Telecommunication services –1.8% YTD, Industrials –4.98% YTD, Utilities –6.22% YTD, Materials –7.13% YTD and Energy –16.41%
YTD. |