|
The S&P 500 and the broader U.S. equity markets began a three-day sell-off after the Federal Reserve released the minutes from the July 28-29 Federal Open Market Committee (FOMC) meeting on Wednesday. According to the minutes, “Most judged that the conditions for policy firming had not yet been achieved, but they noted that conditions were approaching that point,”. No one actually knows what the statement really means as personal consumption expenditures (PCE) inflation continues to run well below the FOMC's longer-run objective of 2%.
The Core PCE inflation, which excludes food and energy prices, was 1-1/4% over the 12 months ending in May, restrained in part by declines in the prices of non-energy imports, said the minutes. The latest data from the Bureau of Economic Analysis released after the FOMC meeting on August 3 showed that the Core PCE inflation trend continues as the June Core PCE index increased just 1.29% year-on-year to 109.40, compared to 108.01 for same period last year.
As a matter of fact, the decline in energy prices is not transitory and the renminbi devaluation by the People’s Bank of China (PBoC) will drive the prices of non-energy imports even lower. Thus, a near-term uptick in the PCE and Core PCE are unlikely.
The Fed statement, “conditions were approaching”, appeared even more confusing to Wall Street when four out of seven non-farm payrolls reports this year missed the blue-chip economists' expectations while the labor force participation rate is bouncing around the a 38-year low level of 62.6%, meaning about a record 93 million plus Americans, 16 years and older, did not have a job and were not actively trying to find one.
The S&P 500 took a huge loss of 3.19% on Friday after the global financial information and services firm Markit, said its U.S. Manufacturing Flash Purchasing Managers' (PMI) Index fell to 52.9 in August, its lowest since October 2013. A PMI reading above 50 indicates expansion in the sector. The August PMI index is below the final July reading of 53.8% and missed the economists' forecast by Reuters of 54.0.
It didn’t help much either when China's benchmark Shanghai Stock Exchange Composite index took a 4.27% nosedive on Friday after the preliminary reading for the August China Caixin Flash PMI came in at a near six-and-a-half-year low of 47.1, missing a Reuters forecast of 47.7. The Shanghai Composite index has now closed at a level below the key technical support at 3624.73, or a 30% correction. The European and U.S. equity markets might get spooked by that, as most recessions are accompanied by equity market declines of 30% or more, meaning China might go into a recession.
The S&P 500 Volatility index (VIX), traded on the Chicago Board Options Exchange (CBOE), spiked to 28.03 on Friday, the level not seen since mid-October 2014. At the height of the last market correction in mid-October 2014, the S&P 500 plunged 3.04% and the VIX spiked to 31.06 on fears of slow U.S. economic growth, rising Ebola fears and continued uncertainty about the Federal Reserve. The VIX, which shows the market's expectation of 30-day volatility, is often referred to as the "investor fear gauge". A VIX level between 25 and 50 is usually a signal for big trouble ahead in the U.S. and for the global economy.
The U.S. 10-Year Treasury Note yield, which registered at 2.05% or the 61.8% Fibonacci retracement level on Friday, could drop below 2% next week if the fears of a U.S. and global economic slowdown continue. The U.S. 2-Year Treasury Note yield, which has been stuck under 0.75% since the beginning of the year, ticked down about 9% from the previous close to as low as 0.617%. The Federal Reserve may be losing control of the short-end of the bond market as the yield spread between the U.S. 2-Year and 10-Year Treasury Notes fell to 1.41 percentage points on Friday.
A decline in the short-term borrowing rate, such as the U.S. 2-Year Treasury Note, and flattening of the yield curve could signal that trouble is ahead for the U.S. economy. In July, the IMF gave a warning to the Federal Reserve, for the second time, that it risks stalling the U.S. economy by raising interest rates too early and called for the central bank to delay a move until 2016.
As of August 18, there are 165,115 short positions of S&P 500 Futures, (CME:SP), traded on the Chicago Mercantile Exchange (CME) by leveraged funds, a decrease of 1,239 short positions from the previous week. This is compared to about 92,831 long positions, up 7,032 from the previous week, according to the Commitment of Traders (COT) data released by the Commodity Futures Trading Commission (CFTC) each Friday. Ahead of the options expiration week, some hedge funds may have decided to increase their net long positions by about 8,271 contracts from the previous week, where contracts of S&P 500 futures are traded in units of $250.00 x S&P 500 index.
The S&P 500 closed at 1,970.89 on Friday, down 5.77% for the week. The best performing S&P 500 sectors were Utilities and Telecommunication services, down 1.15% and 2.61%, respectively as investors rotated money out of high risk sectors into safe haven and high dividend sectors.
The worst performing S&P 500 sectors for the week were Information technology and Energy, which tumbled 7.54% and 7.46%, respectively. Apple [NASDAQ:AAPL] and Microsoft [NASDAQ:MSFT], top constituents of the S&P 500 Information technology, were down 8.8% and 8.36%, respectively. The S&P 500 Energy sector tumbled along with the WTI crude oil price as crude oil dipped as low as $39.86 per barrel on Friday, down 5.5%.
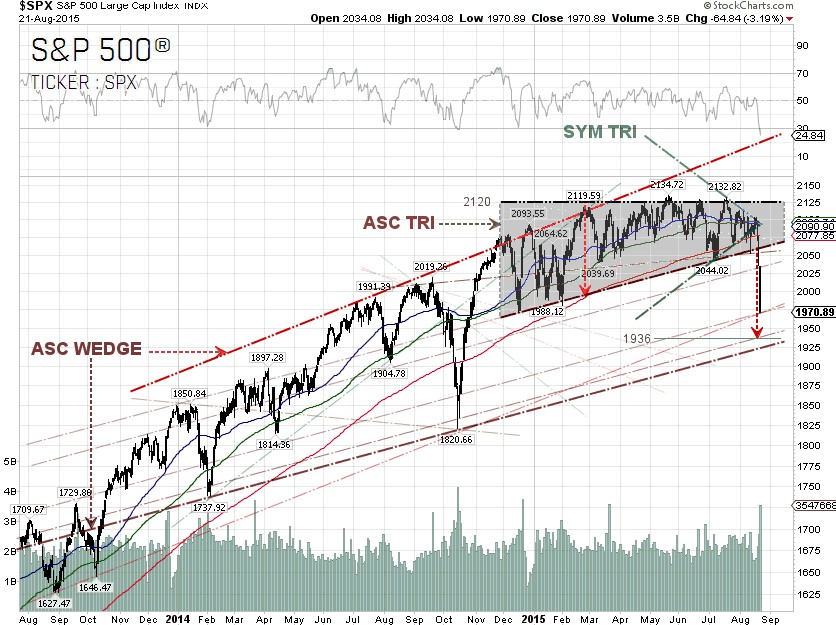
From our technical viewpoint, the S&P 500 has been moving in a bearish ascending wedge since the end of 2013. The index suffered a sequence of technical breakdowns this week, including the breakdown of the symmetrical triangle chart pattern after the Fed minutes were released, and the ascending triangle breakdown after the weak U.S. and China economic news. The projected target for the ascending triangle breakdown is 1,936. There is a two-year trendline support at around 1,930. Hopefully, the S&P 500 can bounce off from there.
S&P 500 Summary: –4.27% YTD as of 08/21/15
Barclay Hedge Fund Index: +2.79% YTD
Outperforming Sectors: Healthcare +4.44% YTD, Consumer discretionary +2.8% YTD, Consumer staples –2.04% YTD, Telecommunication services –3.44% YTD and Financials –4.18%
YTD.
Underperforming Sectors: Information technology –5.14% YTD, Utilities –5.19% YTD, Industrials –9.03% YTD, Materials –11.33% YTD and Energy –21.19% YTD and. |