|
There are more warning signs this week that something is wrong with the U.S. economy. A preliminary reading of the Markit Economics monthly flash services purchasing manager's index
(PMI) for February, came in on Wednesday at 49.8, missing the estimate of 53.5 by a wide margin. A reading below 50 means the service sector of the U.S. economy is in contraction. The U.S. Commerce Department said on Monday that new home sales in January are falling apart as only 494,000 homes were sold in January, versus the estimate of 520,000. This shouldn't be a surprise since the Fed rate hike is supposed to slow down the economy.
The durable good orders for December and January were a wash. The Commerce Department said on Thursday that orders for durable goods, items ranging from toasters to aircraft meant to last three years or more, rebounded 4.9% in January, after a 4.6% plunge in December, beating economists’ expectations for a 2.5% rise. The so-called core capital goods orders, nondefense capital goods excluding aircraft, jumped 3.9% after dropping 3.7% in December.
The Commerce Department said on Friday that the personal consumption expenditures
(PCE) price index rose to 109.96 in January, from 108.59 in January 2015, a 1.26% increase on a year-on-year basis. The so-called core PCE price index, excluding food and energy, climbed to 110.41 in January from 108.59 in January 2015, a 1.68% jump in the 12 months through January, but below the FOMC's longer-run objective of 2%.
Separately, the Commerce Department said on Friday that it revised their second estimate of the U.S. gross domestic product (GDP) upward to a 1.0% annual rate from the previously reported 0.7% pace, citing that businesses accumulated $81.7 billion worth of inventory rather than the $68.6 billion reported last month. Economists polled by Reuters had expected that fourth-quarter GDP growth would be revised down to a 0.4 percent. Businesses seemed to be less aggressive in their efforts to reduce unwanted inventory and that could hurt output in the first-quarter 2016, said Reuters’ economists.
The WTI crude oil price jumped 10.50% for the week, but closed on Friday on a bearish note, with a shooting star candlestick chart pattern. Traders were trying to interpret what Saudi oil minister Ali Ibrahim
Al-Naimi meant when he mentioned “production freeze” on Tuesday during a keynote speech at the IHS CERAWeek conference in Houston. Venezuela’s Oil and Mining Minister Eulogio del Pino said on Thursday that representatives from Russia, Saudi Arabia, Qatar, and Venezuela would meet in mid-March to discuss cooperative efforts to stabilize oil prices.
There will be refinery shutdowns for maintenance in the U.S. during the next few weeks so the crude oil data will be all over the place, meaning more volatile crude prices. The EIA said on Wednesday that U.S. refineries ran at 87.3% of capacity in the week ending February 19, a week-over-week decrease of about 163,000 barrels a day.
Some on Wall Street are thinking that the Fed will keep hiking interest rates until the U.S. and global economies fall into recession. Kansas City Fed President Esther George, in an interview on Bloomberg radio on Tuesday, said Federal Reserve policymakers should be prepared to consider raising interest rates in March, despite recent financial market volatility. She reiterated her hawkish stance, as she sees a rosy economy ahead and solid growth this year.
The U.S. bond market seems to have a different opinion, since the yield spread between the 10-year and 2-year U.S. Treasury Notes narrowed on Friday to 0.96 percentage points, an 8-year low. The bond market is telling the Fed that the U.S. economy is heading towards trouble.
Willem Buiter, Chief Economist at Citigroup, sent out a note on Wednesday to their clients to get ready for a global recession, reported Bloomberg. "The most recent deterioration in the global outlook is due to a moderate worsening in the prospects for the advanced economies, a large increase in the uncertainty about the advanced economies' outlook (notably for the U.S.) and a tightening in financial conditions everywhere," said Buiter in his note.
According to the Commitment of Traders (COT) data released by the Commodity Futures Trading Commission (CFTC) for the week ended February 23, there are 141,995 short positions of S&P 500 consolidated futures, traded on the Chicago Mercantile Exchange (CME) by leveraged funds, a decrease of 4,782 short positions from the previous week. This is compared to about 70,328 long positions, a decrease of 722 from the previous week.
The data suggests that hedge funds remain undecided in what direction the S&P 500 will move next and decided to cut both short and long positions from their holdings. This resulted in an increase in net long positions of S&P 500 consolidated futures by about 4,060 contracts, where contracts of S&P 500 futures are traded in units of $250.00 x S&P 500 index.
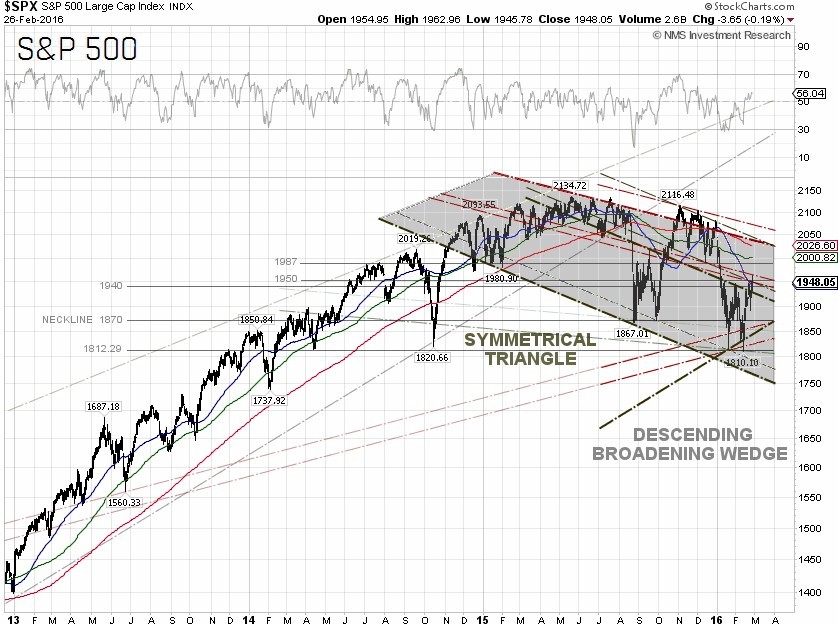
The S&P 500 closed at 1,948.05 on Friday, up 1.58% for the week, rising for the second week in the row. The best performing S&P 500 sectors for the week were Materials and Consumer discretionary, which were up 3.06% and 2.83%, respectively. The worst performing sectors for the week were Energy and Utilities, up 0.4% and down –0.14%, respectively.
Technically, the S&P 500 closed above 1,944.02, or the 50-day moving average, but with a negative tone, meaning the closing price was below the opening price and the previous day's closing price. The near-term head resistance for the index is at 1,987, where a breakout will confirm the double bottom, which could send the S&P 500 upward to retest the 2,000 level. As crude oil prices continue to be coupled with the S&P 500, there could be additional selling pressure on the index as we don’t see a WTI crude oil bottom until crude prices can close and stay above $37.75 per barrel.
S&P 500 Summary: –4.69% YTD as of 02/26/16
Barclay Hedge Fund Index: –2.95% YTD
Outperforming Sectors: Telecommunication services +8.83% YTD, Utilities +6.12% YTD, Consumer staples +0.9% YTD, Industrials –1.83% YTD, Materials –3.49% YTD, Energy –4.45% YTD, and Consumer discretionary –4.47% YTD.
Underperforming Sectors: Information technology –5.73% YTD, Healthcare –6.83% YTD, and Financials –10.92%
YTD. |