|
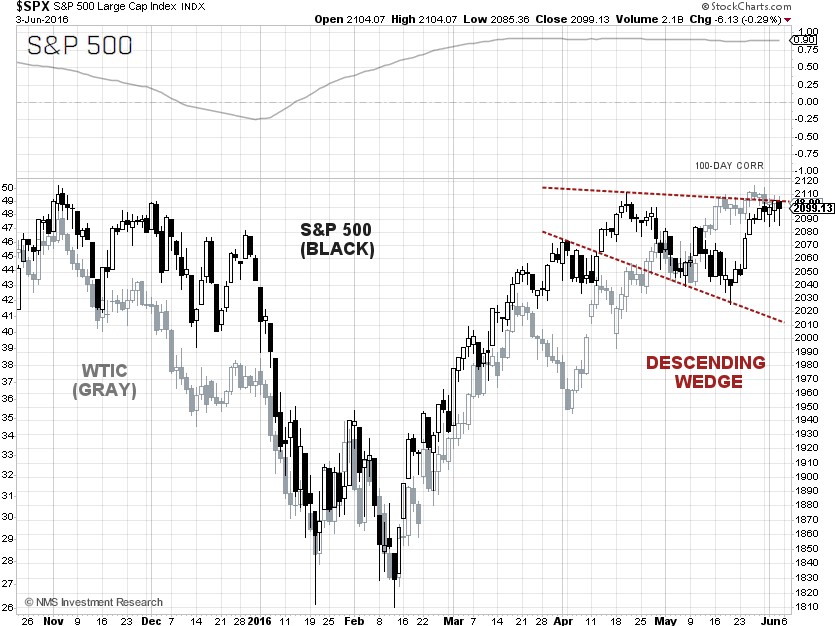
The S&P 500 closed at 2,099.13 on Friday, unchanged for the week, as sector rotation continues. The best performing S&P 500 sectors for the week were Utilities and Healthcare, up 2.49% and 1.51%, respectively. Utilities was the worst performing sector last week. The worst performing sectors for the week were Energy and Financials, which were down 1.02% and 1.29%, respectively. Financials was the best performing sector last week. Fund managers are rotating out of Financials and piling into Utilities in anticipation of a U.S. economic downturn.
The Department of Labor said on Friday that there were only 38,000 jobs added in May, far worse than Wall Street economists' forecast of 155,000 jobs. The unemployment rate in May, however, dropped to 4.7%, from 5.0% in April, for the wrong reason as the labor force participation rate sunk to 62.6%, near its 38-year low. The Department of Labor also said that May's average hourly wages rose by $0.05 from the previous month, to $25.59, or at a 2.52% annual growth rate.
More bad news for the U.S. economy came from the Institute for Supply Management (ISM) on Friday that said its May services index fell to 52.9, the lowest reading since February 2014. Analysts had expected the index to drop to 55.5. The worse-than-expected jobs report prompted the Federal Reserve Bank of New York to trim its GDP growth forecast on Friday for both the second- and third-quarter 2016 to 2%.
Ironically, Cleveland Federal Reserve President Loretta Mester, a voting member of the
FOMC, told reporters in Stockholm on Saturday that the latest disappointing U.S. jobs number has not changed the overall economic picture and gradual rate hikes remain appropriate.
The U.S. dollar index, a weighted index of the value of the U.S. dollar relative to a basket of six major currencies, plunged 1.54% for the week to close on Friday at 94.028. The yield spread between the 10-year and 2-year U.S. Treasury Notes printed at 0.9168 percentage points at the close on Thursday, a level not seen since late 2007. The bond market may be in a sour mood, as economic data released on Wednesday, including the Beige Book for May by the Fed, U.S. auto sales, and U.S. mortgage applications were between “so-so” and “disappointing”.
The WTI crude oil spot price declined just 1.33% for the week, to close at $48.90 per barrel on Friday, despite bearish weekly crude oil inventory reports, an unsurprising outcome from the OPEC meeting and the worse-than-expected nonfarm payrolls report. At the OPEC meeting in Vienna, the members failed to agree on anything, including policy change and a production ceiling.
The Energy Information Administration (EIA) weekly U.S. oil inventory report on Thursday showed a draw of 1.37 million barrels to 535.7 million barrels in the week ending May 27, compared to analysts’ expectations for a drawdown of 3.1 million barrels. The American Petroleum Institute (API) inventory data on Wednesday showed U.S. crude inventories increased by 2.35 million barrels.
The EIA also said the weekly U.S. crude oil production fell again for the eighteenth consecutive week, to 8.735 million barrels per day (bpd) for the week ending May 27, 2016, the lowest level since September 5, 2014, at 8.59 million bpd. Weekly U.S. crude oil output has fallen 9.11% from the peak level of 9.61 million bpd during the week ending June 6, 2015. Houston-based oilfield services company Baker Hughes Inc. said on Friday that the U.S. oil rig count was up 9 from last Friday at 325, a 79.8% drop from the peak number of 1,609 in October 2014.
History could repeat itself, as the yield spread between the 10-year and 2-year U.S. Treasury Notes is ready to fall of the cliff. From a historical perspective of the Fed leading up to the last U.S. recession, from December 2007 through March 2009, the Fed began hiking the short-term rate from 1.0% to 1.25% in June 2004 as the yield spread between the 10-year and 2-year U.S. Treasury Notes stood at 1.9 percentage points. By the time the Fed raised the key rate by a quarter-percentage point to 5.25% for the last time in June 2006, the yield spread was already in negative territory. Rising crude oil prices exacerbated the situation. About 12 months after the yield spread was negative, the U.S. went into a deep recession until early 2009.
S&P 500 Summary: +2.70% YTD as of 06/03/16
Barclay Hedge Fund Index: +0.89% YTD
Outperforming Sectors: Utilities +14.96% YTD, Telecommunication services +11.52% YTD, Energy +10.23% YTD, Materials +9.11% YTD, Consumer staples +5.57% YTD and Industrials +4.50% YTD.
Underperforming Sectors: Consumer discretionary +1.06% YTD, Information technology +0.86% YTD, Healthcare +0.04% YTD and Financials –1.71%
YTD. |