|
The S&P 500 closed at 2,046.61 on Friday, down 0.51% for the week, but up 0.13% year-to-date. The best performing S&P 500 sectors for the week were Utilities and Consumer staples, which were up 0.87% and unchanged, respectively. Money rotated into safe havens and non-cyclical stocks, which tend to outperform during a recession, despite that the U.S. economic data reported was upbeat. The worst performing sectors for the week were Consumer discretionary and Financials, which were down 1.34% and 1.10%, respectively.
The Department of Commerce said on Friday that advance estimates of “adjusted” total U.S. retail sales in April, excluding food services, surged 1.39% from March 2016 to $399.32 billion, and up 2.71% from last year. On an “unadjusted” basis, U.S. retail sales were down 2.34% from March 2016 to $394.61 billion, but up 2.21% from last year. “Adjusted” nonstore retailer sales, including e-commerce sales and mail order catalogs, in April 2016 were up just 2.08% from March 2016 to $45.24 billion, but up 10.16% year-on-year. The “unadjusted” nonstore retailer sales in April 2016 were up 9.44% from March 2016 to $44.97 billion, and up 14.41% year-on-year.
This came on the heels of the worst quarterly sales number since the 2008 recession reported on Wednesday by Macy’s, the largest department-store chain in the U.S. Here is how Macy’s CEO put it, "We were at a loss to explain why consumers weren’t spending in our stores...We’re, frankly, scratching our heads,”. Kohl's, Nordstrom, JCPenney and many other retailers also reported similar worse-than-expected first-quarter 2016 sales this week.
There are warning signs from the financial markets that the U.S. economy may be one step closer to a recession. The 10-year U.S. Treasury Note yield tumbled another 4.33% for the week to close at 1.702% on Friday. If the 10-year yield breaks below the 1.60% level, the probability of a Fed rate hike will be “zero”, unless the Fed wants to send the U.S. economy into a recession. The yield spread between the 10-year and 2-year U.S. Treasury Notes sunk 4.04% to close at 0.95 percentage points on Friday, testing the March 8 low, a level not seen since late 2007.
The Financials sector sold off as narrowing yield spreads between the 10-year and 2-year U.S. Treasury Notes means that financial institutions will be less profitable down the road due to lower net interest margins. Falling spreads may also indicate worsening economic conditions in the future, resulting in a flattening yield curve. A very low or negative spread could signal an upcoming recession. Since 1960, each time that the yield spread went negative, a recession followed approximately 12 months later.
The S&P 500 Utilities sector is now trading near its all-time high, as money rotated into safe havens. The last time Utilities outperformed the broader market, the U.S. economy entered into a recession 12 months later.
The U.S. dollar index climbed 0.76% to close on Friday at 94.593, just under the major trendline resistance, as some Federal Reserve officials have been talking up the U.S. dollar during the past two weeks. Boston Fed President Eric Rosengren, a voting member of the Federal Open Market Committee (FOMC), said to business leaders during a speech in Concord, New Hampshire on Thursday that the economy appears to be strengthening after the sluggish first-quarter, giving the green light for the U.S. central bank to continue its attempt to normalize their interest-rate policy.
Since October 2015, the S&P 500 and WTI crude oil price are highly correlated with a coefficient of 0.9 over a 100-day period, where 1 is total positive correlation. The WTI crude oil spot price ran up 5.54% for the week to close at $47.03 per barrel on Friday, following a crude inventory draw that was more than expected and a bullish report from the International Energy Agency (IEA).
The Energy Information Administration (EIA) weekly U.S. oil inventory report on Wednesday showed a draw of 3.4 million barrels in the week ending May 6, compared to analysts’ expectations for a small build of 300,000 barrels. The American Petroleum Institute (API) inventory data on Tuesday showed U.S. crude inventories rose by 3.45 million barrels to record highs of 543.1 million during the week ended May 6. The gap between the EIA and API data may be related to the uncontrolled wildfire in Canada’s province of Alberta last Wednesday, which shut down one major oil sands mining operation and forced another to curtail production.
The EIA also said the weekly U.S. crude oil production fell again for the fifteenth consecutive week, to 8.802 million barrels per day (bpd) for the week ending May 6, 2016, the lowest level since September 5, 2014, at 8.59 million bpd. Weekly U.S. crude oil output, however, has fallen 8.41% from the peak level of 9.61 million bpd during the week ending June 6, 2015.
More bullish news for the oil market came from Houston-based oilfield services company Baker Hughes Inc., who said on Friday that the U.S. oil rig count is now down another 10 to 318, an 80.24% drop from the peak number of 1,609 in October 2014.
The WTI crude oil price jumped 0.94% on Thursday, after the IEA said that global oil stocks will experience a "dramatic reduction" in the second-half of the year on the back of strong demand and falling supply by some major producers. A series of production outages around the globe have also taken barrels out of the market in recent weeks, providing support to prices.
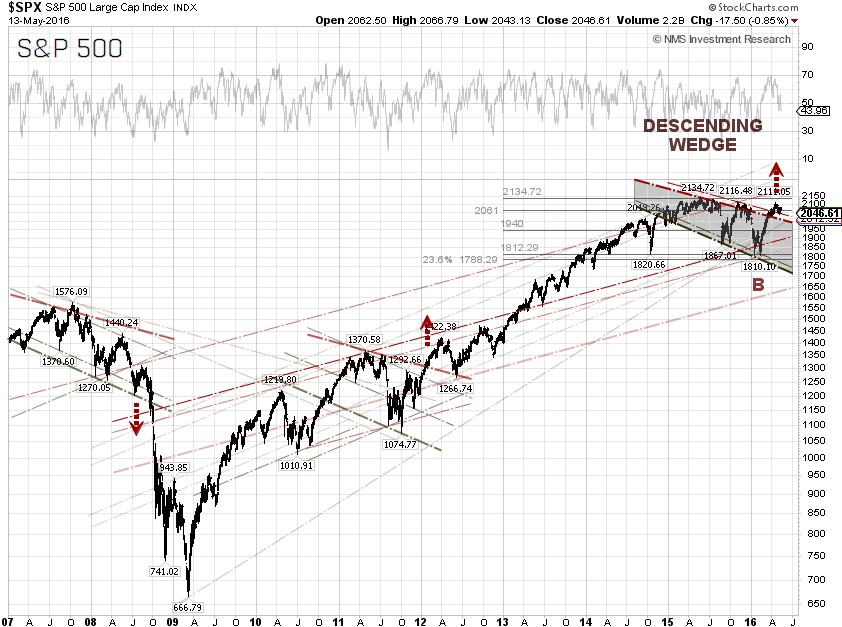
Technically, the S&P 500 has been trading between the technical levels of 2,081 and 2,041 and just dropped below the 50-day moving average. So far, earnings results have been mixed, due in part to a strong U.S. dollar and weak demand domestically and abroad. The S&P 500 could pull back further and test the trendline support of the descending wedge at 2,012, or the 200-day moving average, if the yield of the 10-year U.S. Treasury Note continues descending.
S&P 500 Summary: +0.13% YTD as of 05/13/16
Barclay Hedge Fund Index: +0.00% YTD
Outperforming Sectors: Utilities +13.57% YTD, Telecommunication services +11.46% YTD, Energy +8.19% YTD, Materials +5.26% YTD, Consumer staples +5.11% YTD, and Industrials +2.98% YTD.
Underperforming Sectors: Consumer discretionary –0.11% YTD, Information technology –3.36% YTD, Healthcare –4.15% YTD, and Financials –4.31%
YTD. |