S&P 500

S&P 500 Bounced Off Trendline Supports as Apple Shares Surged

Witawat (Ed) Wijaranakula, Ph.D.
Fri Sep 16, 2016

The S&P 500 inched up 0.53% for the week, to close on quadruple-witching Friday at 2,139.16, while most of that gain, about 0.36%, came from Apple Inc. (NASDAQ:AAPL). Shares of Apple skyrocketed 11.43% for the week as the company disclosed that its new iPhone 7 Plus and jet black iPhone 7 are sold out worldwide. This came on the heels of announcements of a massive global recall of Samsung Galaxy Note 7 smartphones due to serious fire and burn hazards.

The S&P 500 jumped 1.47% on Monday after Fed Governor Lael Brainard, in a speech at the Chicago Council on Global Affairs, warned against moving to quickly on rate hikes. The index gave up most of that gain on Tuesday and the rest of the week after crude prices started crashing, while the U.S. dollar index surged.

The WTI crude spot price nosedived 4.93% for the week, to close on Friday at $43.62 per barrel, while the Brent crude spot price sank 3.95% to close at $45.99 per barrel, after both the International Energy Agency (IEA) and OPEC revised their forecasts on Tuesday that signaled the global crude glut could extend into 2017 on weaker demand. In the monthly crude oil market report released by IEA, it said, “Supply will continue to outpace demand at least through the first half of next year,” and “Recent pillars of demand growth -- China and India -- are wobbling.”

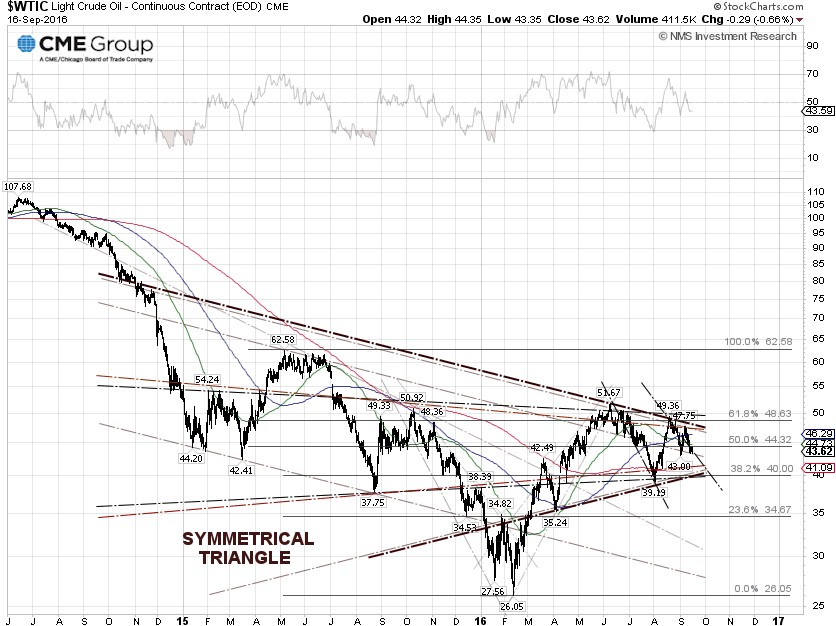
More selling pressures for oil came from the rise in the U.S. dollar on Fed rate hike fears, as the U.S. dollar index jumped 0.84% this week, and a Reuters report on Friday that Iran's August crude oil exports jumped 15% from July, to more than 2 million barrels per day (bpd), the highest level since 2012.

The EIA weekly U.S. oil inventory report on Wednesday showed a decrease of 600,000 barrels to 510.8 million barrels, excluding the Strategic Petroleum Reserve, in the week ending September 9, compared to S&P Global Platts analysts’ expectations for a rise of 3.3 million barrels. The American Petroleum Institute (API) inventory data on Tuesday showed a U.S. crude inventory increase of 1.4 million barrels. 

Separately, the EIA said the weekly U.S. crude oil production increased by 34,000 bpd for the week ending September 9, 2016, to 8.493 million bpd. Weekly U.S. crude oil output has fallen about 11.62% from the peak level of 9.61 million bpd during the week ending June 5, 2015. Houston-based oilfield services company Baker Hughes Inc. said on Friday that the U.S. oil rig count rose by 2 to 416, compared to 316, when the rig count hit the low on June 6, 2016. 

Overall, U.S. economic growth remains a mixed bag. On Thursday, the Federal Reserve Bank of Atlanta knocked off another 30 basis points from its third-quarter 2016 GDP forecast, to 3.0% from the previous 3.3%, after the U.S. Department of Commerce said core retail sales excluding automobiles, gasoline, building materials and food services, came in at -0.1% for August, missing the analysts forecast of a 0.2% gain on a month-on-month basis. 

The Federal Reserve Bank of New York is less optimistic about the U.S. economy and put its forecast at 2.8% and 1.7% for the third- and fourth-quarter 2016, respectively. The blue chip consensus U.S. GDP 2016 forecast currently is 1.8%, and that is very tepid.

The U.S Bureau of Labor Statistics, Department of Labor, said on Friday that the core CPI rose 0.3% in August, compared to a forecast of a 0.2% increase, as housing and medical costs continued to rise. Although the Fed doesn’t use CPI data and relies mostly on the personal consumption expenditures (PCE) measure instead, the market sold off while the U.S. dollar index jumped 0.79% on Friday.

The yield of the 10-year U.S. Treasury Note climbed 1.13% to close at 1.694% on Friday, as investors sold bonds and moved money into cash. The yield spread between the 10-year and 2-year U.S. Treasury Notes widened to 0.93 percentage points at the close on Friday. The probability of a 25 basis point rate hike at the next FOMC meeting on September 21, dropped 12 percentage points from the previous week to 12.0% on Friday, while the probability of a no change in monetary policy rose to 88.0%, based on the CME Group 30-day Fed Fund futures prices as of September 16.

Investors need to be cautious though, as there are signals that the Fed could make a move at the FOMC meeting next week. First, the yield of the 10-year U.S. Treasury Note is about to break out of the descending wedge chart pattern, and second, the effective federal funds rate (EFFR) is now at 0.4%, which is above the mid-range of the fed funds target at 0.375%, according to the Federal Reserve Bank of New York as of September 16.

The best performing S&P 500 sectors for the week were Information technology and Utilities, up 3.03% and 2.42%, respectively. The worst performing sectors for the week were Energy and Financials, down 2.91% and 1.26%, respectively. 

S&P 500 Summary: +4.66% YTD as of 09/16/16
Barclay Hedge Fund Index: +3.37% YTD 

Outperforming Sectors: Utilities +13.78% YTD, Telecommunication services +13.23% YTD, Energy +10.78% YTD, Information technology +9.78% YTD, Materials +7.41% YTD, and Industrials +5.88% YTD.

Underperforming Sectors: Consumer staples +4.61% YTD, Real Estate +3.15%, Consumer discretionary +0.49% YTD, Healthcare +0.14% YTD, and Financials –0.81% YTD.

Disclosure: Long position in AAPL and no recommendation.

S&P 500 ANALYSIS

Most Recent Articles  |  Older Articles            

 Infotix Systems, Inc. -  NMS (Not Main Street) Research - privacy & security policy
All rights reserved