|
On Monday, the S&P 500 bounced 0.78% off Friday's low, along with a surge in crude oil futures, as the crude oil January’16 futures contract expired at $34.55 a barrel and the February’16 contract began trading at $35.83 a barrel, or a 3.71% jump. The crude oil rally continued on Tuesday and Wednesday after the U.S. Energy Information Administration
(EIA) reported that U.S. commercial crude oil inventories dropped slightly to 484.8 million barrels, down 5.9 million barrels in the week ending December 18, compared to analysts’ expectations of an inventory increase of 1.1 million barrels.
The traders covered their short positions and sent the spot WTI crude oil price higher, and the S&P 500 along with it, up 3.89% and 1.24%, respectively. Tom
Kloza, OPIS Global Head of Energy Analysis, told CNBC that the rally in the last couple of days was a little bit of a foolish rally. He still thinks that the crude prices will retest the lows in late-February and March, when refineries go to maintenance, and that prices are going to test the December 2008 level of $32.40 to $33.
The S&P 500 Materials sector got a boost on Tuesday after a Reuters report said that the Chinese government officials announced, at the close of a key meeting of China's Communist leadership, a series of reforms, including plans to make China's monetary policy more flexible and to expand the government's budget deficit next year. Analysts believe that the raft of measures will provide support to a slowdown in the home building sector in China.
The U.S. economic readings this week were a mixed bag. The Department of Commerce said on Tuesday that it revised the U.S. gross domestic product (GDP) in the third-quarter to 2.0% from 2.1% growth estimated last month, as business inventories were larger than had been previously estimated. Economists surveyed by The Wall Street Journal estimated the latest revision would show 1.9% growth.
The Department of Commerce also said on Wednesday that new orders for manufactured durable goods, products designed to last at least three years, increased $0.1 billion in November, or virtually unchanged, to $238.8 billion. Orders for durable goods in the first 11 months of 2015 fell 3.7% from the same period a year earlier. A closely watched proxy for how much businesses are spending on new equipment — the non-defense new orders of capital goods excluding aircraft, decreased $5.2 billion, or 6.3%, to $77.2 billion in November.
“Unless we see a big rebound in December or upward revisions, it appears that investment in equipment contracted in the fourth-quarter,” said Paul Ashworth, chief U.S. economist at Capital Economics, according to The Wall Street Journal. Forecasting firm Macroeconomic Advisers said Wednesday it expected U.S. GDP to expand at a 1.7% pace in the fourth-quarter, cutting its earlier projection of 1.9% growth.
The Federal Reserve Bank of Atlanta turned sour on U.S. GDP growth in the fourth-quarter of 2015, as the bank revised its forecast downward to 1.3% on Wednesday, from 1.9% just a week ago. The Atlanta Fed cited the third-quarter GDP downward revision and weak fourth-quarter real consumer spending growth, which fell from 2.6% to 2.1%, to be the reasons.
Separately, the Department of Commerce said the latest reading of the core PCE for November came in at 109.96, or 1.33% year-on-year, little changed from the previous month’s 1.28%. Thus, the Fed may have to sit and wait for a while until inflation gets to their target level, especially when the crude oil price is tumbling. Fed Chair Janet Yellen thinks that crude oil and other commodity prices will find the bottom sometime and inflation will start rising. That is what she hopes.
The yield of the U.S. 10-Year Treasury Note jumped 2.09% for the holiday-shortened week, to close at 2.25% on Thursday, while the U.S. dollar index (DXY) inched 0.72% lower from the previous week, to close at 98.02, below the key technical head resistance at 98.14. The yield of the U.S. 2-Year Treasury Note skyrocketed another 8.19% to close at 1.03% on Thursday, while the yield spread between the 10-year and 2-year Treasury Notes remains unchanged at 1.22 percentage points for the week, the lowest since February.
The 10-year/2-year yield spread has fallen over 30% since the beginning of July. Falling spreads may indicate worsening economic conditions in the future, resulting in a flattening yield curve. A very low or negative spread could signal an upcoming recession.
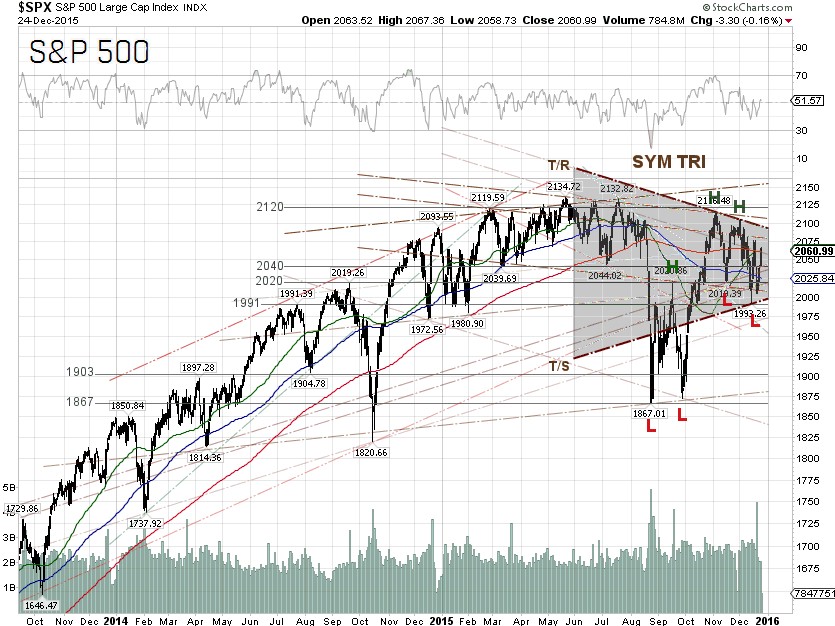
The S&P 500 closed at 2060.99 on Thursday, up 2.76% for the short week. The best performing S&P 500 sectors for the week were Energy and Materials, which were up 4.6% and 4.28%, respectively. Materials was the worst performing S&P 500 sector last week. The worst performing S&P 500 sectors for the week were Utilities and Consumer discretionary, which were up 2.3% and 1.35%, respectively. Utilities was the best performing S&P 500 sector last week.
Technically, the index is moving in a symmetrical chart pattern indicating that the market seems not to be able to decide what the next move might be. The S&P 500 will have to make a decision soon though, as the earnings season will begin in about three weeks and the Fed rate hike is off the table for now.
The probability of a rate hike at the Fed’s FOMC meeting on January 26-27 is 10%, based on the 30-day prices of federal funds futures, traded on the Chicago Mercantile Exchange and commonly used to estimate the market’s views on the likelihood of changes in U.S. monetary policy, according to data from the CME Group as of December 24.
S&P 500 Summary: +0.1% YTD as of 12/24/15
Barclay Hedge Fund Index: +0.97% YTD
Outperforming Sectors: Consumer discretionary +8.84% YTD, Healthcare +5.85% YTD and Information technology +5.14% YTD and Consumer staples +4.54% YTD.
Underperforming Sectors: Telecommunication services –0.79% YTD, Financials –2.64% YTD, Industrials –4.05% YTD, Utilities –7.92% YTD, Materials –8.84% YTD and Energy –21.81%
YTD. |