|
The S&P 500 slid 0.94% on Thursday, following the WTI crude oil price, which came off an intraday high of $37.79 a barrel to close at $37.07 a barrel, after the news broke that Iranian President Hassan Rouhani went on
T.V. and issued an order calling for the country’s Defense Ministry to expedite efforts for boosting Iran's missile power. This was in response to reports of the U.S. plans for imposing fresh sanctions on Tehran over Iran's test-launching of a medium-range ballistic missile in October, in violation of U.N. resolutions.
According to a report by The Wall Street Journal published at 7:01 p.m. ET on Thursday, the White House sent a notification to Congress on Wednesday morning that the U.S. Treasury Department would announce, at 10:30 a.m. ET, new sanctions on nearly a dozen companies and individuals in Iran, Hong Kong and the United Arab Emirates for their alleged role in developing Iran’s ballistic missile program.
At 10 p.m. ET on Wednesday, the White House informed Congress that it had delayed its plan to impose new financial sanctions on Iran and didn’t specify when they might go ahead, amid growing tensions with Iran that could jeopardize the nuclear deal struck earlier this year.
In July, the P5+1 countries, which include the U.S., Russia, U.K., France, China and Germany, announced that they reached a nuclear deal with Iran. The sanctions are supposed to be lifted, as soon as January, which could eventually pave the way for the return of about 1 million barrels a day of Iranian crude to global markets.
Earlier in the week, the S&P 500 fell 0.72% on Wednesday, along with the spot WTI crude oil price that slid 1.34%, after the U.S. Energy Information Administration
(EIA) reported that U.S. commercial crude oil inventories rose to 487.4 million barrels, up 2.6 million barrels in the week ending December 25, compared to analysts’ expectations of an inventory decline of 1 million barrels.
Stock markets have been trading in a direct correlation with the crude oil prices of late. The commodities, particularly crude oil, are traded in inverse correlation with the U.S. dollar, as a strong dollar hurts sales and profits of U.S. multinational companies, and therefore the stock markets.
According to the Commitment of Traders (COT) data released by the Commodity Futures Trading Commission
(CFTC) for the week ended December 22, there are 126,241 short positions of S&P 500 consolidated futures, traded on the Chicago Mercantile Exchange
(CME) by leveraged funds, an increase of 2,391 short positions from the previous week. This is compared to about 73,739 long positions, down 17,541 from the previous week.
The data suggested that hedge funds rotated out of their long positions resulting in a decrease in a net long positions of 19,932 contracts, worth about $10 billion, where contracts of S&P 500 futures are traded in units of $250.00 x S&P 500 index. During the same period, hedge funds decreased their net long positions of light sweet crude oil futures, traded on the New York Mercantile Exchange (NYSE), by about 17,351 contracts, reflecting the headline news from the global financial markets.
The yield of the U.S. 10-Year Treasury Note inched up 0.84% for the holiday-shortened week, to close at 2.269% on Thursday, while the U.S. dollar index (DXY) climbed 0.74% from the previous week, to close at 98.75. The yield of the U.S. 2-Year Treasury Note jumped another 2.14% to close at 1.052% on Thursday, while the yield spread between the 10-year and 2-year Treasury Notes remains unchanged at 1.217 percentage points for the week, the lowest since February.
The 10-year/2-year yield spread has fallen over 30% since the beginning of July. Falling spreads may indicate worsening economic conditions in the future, resulting in a flattening yield curve. A very low or negative spread could signal an upcoming recession.
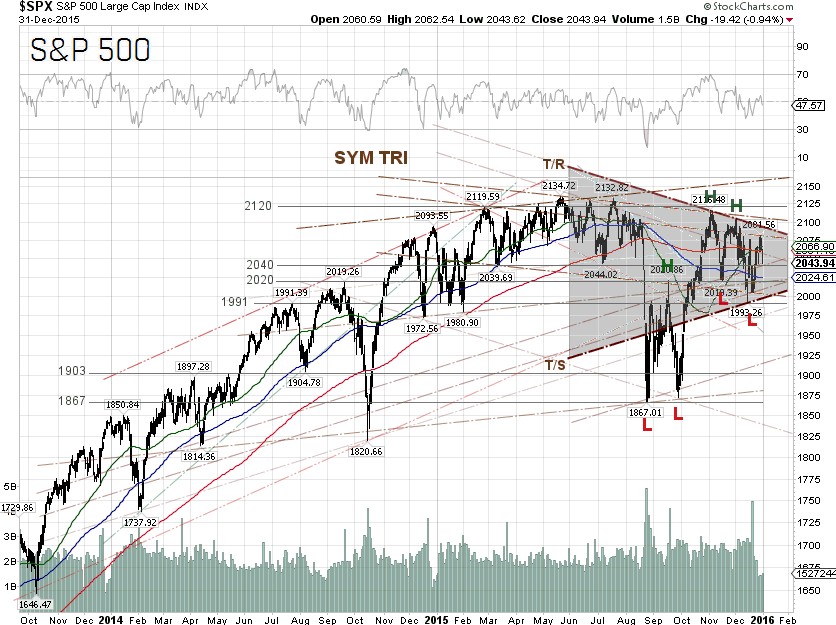
The S&P 500 closed at 2043.94 on Thursday, down 0.83% for the short week and down 0.73% for the year. The best performing S&P 500 sectors this week were Consumer discretionary and Utilities, which were down 0.38% and 0.51%, respectively, while the worst performing sectors for the week were Energy and Materials, which were down 2.23% and 1.67%, respectively. Last week, Utilities and Consumer discretionary were the worst performing S&P 500 sectors, while Energy and Materials were the best performing sectors.
For the full-year 2015, the best performing S&P 500 sectors were Consumer discretionary and Healthcare, which were up 8.43% and 5.21%, respectively. The worst performing S&P 500 sectors for the year were Energy and Materials, which were down 23.55% and 10.36%, respectively.
Technically, the index is moving within a symmetrical chart pattern indicating that the market seems not to be able to decide what the next move might be. The S&P 500 will have to make a decision soon though, as the earnings season will begin in about three weeks and the Fed rate hike is off the table for now.
The probability of a rate hike at the Fed’s FOMC meeting on January 26-27 is 12%, based on the 30-day prices of federal funds futures, traded on the Chicago Mercantile Exchange and commonly used to estimate the market’s views on the likelihood of changes in U.S. monetary policy, according to data from the CME Group as of January 1.
S&P 500 Summary: –0.73% YTD as of 12/31/15
Barclay Hedge Fund Index: –0.61% YTD
Outperforming Sectors: Consumer discretionary +8.43% YTD, Healthcare +5.21% YTD, Information technology +4.27% YTD, and Consumer staples +3.77% YTD.
Underperforming Sectors: Telecommunication services –1.73% YTD, Financials –3.47% YTD, Industrials –4.72% YTD, Utilities –8.39% YTD, Materials –10.36% YTD, and Energy –23.55%
YTD. |