|
The S&P 500 sold off an additional 1.08% on Friday, shrugging off the headline news from the U.S. Department of Labor saying that nonfarm payrolls for December came in at 292,000, exceeding economists’ expectations of 200,000. The better-than-expected jobs report shifted the 50% plus probability of a rate hike from the Fed’s FOMC June 15 meeting to April 27, according to data from the CME Group. The news also sent the spot WTI crude oil price on a roller coaster ride, before closing down 11.3% for the week, at $32.88 per barrel on Friday. Of late, crude oil prices and the equity markets have been moving in-line with each other, meaning if oil prices go up, equity markets will also move higher.
Concerns over some U.S. Federal Reserve officials talking about aggressive rate hikes, a second day of trading halts to China's stock markets within a week, and the yuan devaluation by the People’s Bank of China
(PBoC), sent the spot WTI crude oil price crashing 2.35% on Thursday.
According to Reuters, Richmond Federal Reserve President Jeffrey Lacker said in a speech on Thursday that the Federal Reserve may need to raise interest rates more than four times this year if oil prices stabilize, the dollar stops appreciating and inflation surges toward the U.S. central bank's goal of 2%. In fact, statements by Fed officials seem to contradict each other, as the dollar is unlikely to stop appreciating and crude prices will be volatile if the Fed continues hiking rates in a weak global economy.
Earlier in the week on Monday, Beijing-based Caixin Media Company Ltd. released its
Caixin/Markit manufacturing purchasing managers index (PMI) that came in at 48.2 for December, down from 48.6 in November. Any reading below 50 signals a contraction in business activity. The manufacturing PMI slipped below 50 for the 10th straight month and missed economists' expectations of 48.9.
The weak China manufacturing PMI figure prompted investors to dump shares on the Chinese equities markets, which resulted in a steep dive of the Shanghai Composite Index that triggered circuit breakers to close the index down 6.9% at 3,296.66, its lowest level in nearly three months. The drop led the Shanghai and Shenzhen stock markets to halt trading for the remainder of Monday to avert steeper falls, according to the official Xinhua News Agency. The S&P 500 took a cue from the Chinese markets and tanked to as low as 1,989.68 intraday on Monday, down 2.65%.
According to the Commitment of Traders (COT) data released by the Commodity Futures Trading Commission (CFTC) for the week ended January 5, there are 125,499 short positions of S&P 500 consolidated futures, traded on the Chicago Mercantile Exchange (CME) by leveraged funds, a decrease of 711 short positions from the previous week. This is compared to about 65,287 long positions, down 1,226 from the previous week.
The data suggested that hedge funds might have reduced their both short and long positions resulting in a decrease in a net long positions of just 515 contracts, where contracts of S&P 500 futures are traded in units of $250.00 x S&P 500 index. During the same period, hedge funds increased their net short positions of light sweet crude oil futures, traded on the New York Mercantile Exchange (NYSE), by about 24,315 contracts, reflecting the headline news from the global financial markets.
The yield of the U.S. 10-Year Treasury Note tumbled 6.74% for the week, to close at 2.116% on Friday, while the U.S. dollar index (DXY) inched down 0.15% from the previous week, to close at 98.599. The dollar was under selling pressure, as the PBoC said on Thursday that the bank began intervening to keep the renminbi from falling further. The yield of the U.S. 2-Year Treasury Note took an 11.03% nosedive for the week, to 0.936% on Friday, while the yield spread between the 10-year and 2-year Treasury Notes dipped to 1.18 percentage points and is about to break the February 2015 low of 1.19 percentage points.
The 10-year/2-year yield spread has fallen over 30% since the beginning of July. Falling spreads may indicate worsening economic conditions in the future, resulting in a flattening yield curve. A very low or negative spread could signal an upcoming recession.
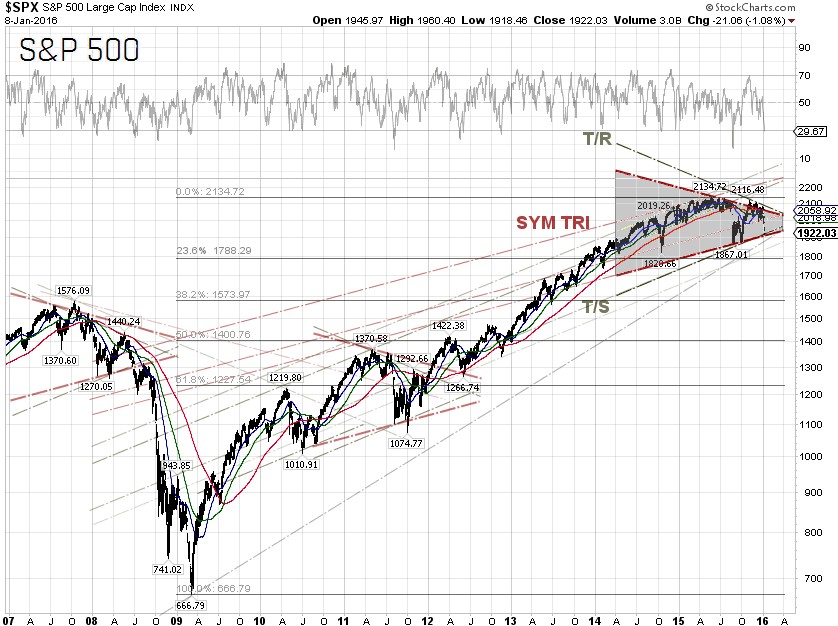
The S&P 500 closed at 1922.03 on Friday, down 5.96% for the week. The best performing S&P 500 sectors for the week were Utilities and Consumer staples, which were down 0.4% and 2.93%, respectively, while the worst performing sectors for the week were Financials and Materials, down 7.47% and 7.82%, respectively. Money was rotated out of interest sensitive sectors into safe havens and dividend stocks.
Technically, the index is moving within a symmetrical chart pattern indicating that the market seems not to be able to decide what the next move might be. The S&P 500 will have to make a decision soon though, as the earnings season begins next week, Alcoa Inc [NYSE:AA] will report their fourth-quarter 2015 earnings on Monday. The debate amongst technicians is whether the observed S&P 500 chart patterns of late will be similar to those in 2008, where the index made a 57.69% correction, or to those in 2011, where the correction was 21.37%.
The bears were out in full force this week. According to Bloomberg on Thursday, billionaire George Soros told the audience at an economic forum in Sri Lanka that global markets are facing a crisis and investors need to be very cautious. “China has a major adjustment problem, … I would say it amounts to a crisis. When I look at the financial markets there is a serious challenge which reminds me of the crisis we had in 2008”, said
Soros.
S&P 500 Summary: –5.96% YTD as of 01/08/16
Outperforming Sectors: Utilities –0.4% YTD, Consumer staples –2.93% YTD, Telecommunication services –2.98% YTD, Healthcare –5.76% YTD, and Consumer discretionary –5.92% YTD.
Underperforming Sectors: Industrials –6.35% YTD, Energy –6.84% YTD, Information technology –7.01% YTD, Financials –7.47% YTD, and Materials –7.82% YTD |