|
The S&P 500 futures had already pointed to a lower opening for Friday, following disappointing data center revenue from Intel on Thursday, and a 3.55% sell-off of the Shanghai Composite Index after the People’s Bank of China
(PBoC) said new loans issued by Chinese commercial banks in December dropped below economists' forecasts. The lower-than-expected new loans suggest that credit demand remained weak, and commercial banks were still reluctant to lend due to rising credit risks.
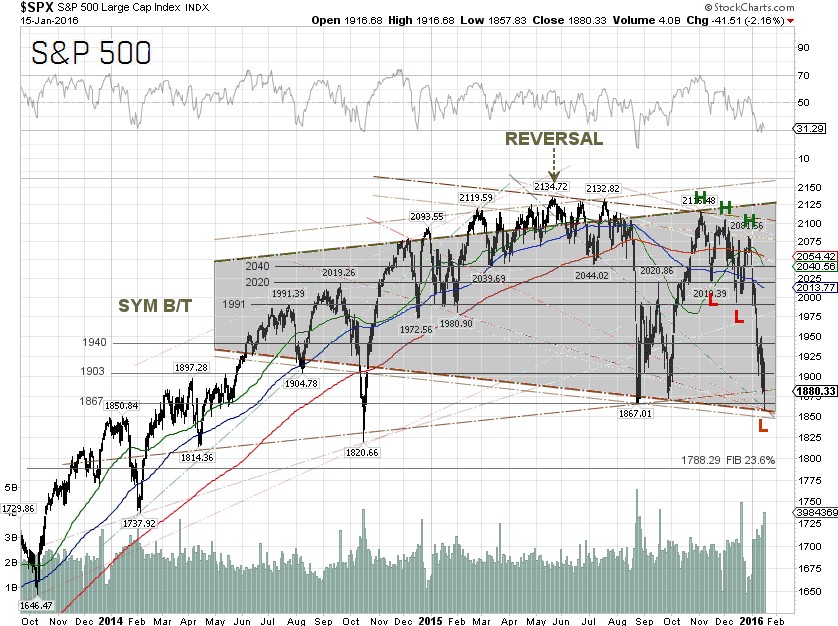
On Friday, the S&P 500 plunged 64.01 points to an intraday low of 1,857.83 before bouncing back to close at 1,880.33, down 2.16% for the day, after a slew of disappointing U.S. economic data was released. The Commerce Department said that retail sales slipped 0.1% last month, following a rise of 0.4% in November. For all of 2015, retail sales rose 2.1%, the weakest reading since 2009, after climbing 3.9% in 2014, according to Reuters. The U.S. Federal Reserve said that industrial production dropped 0.4% in December, for the third straight month, after a downwardly revised 0.9% decline in November. Economists polled by Reuters had forecast industrial production for last month to decrease 0.2%.
Separately, the U.S. Labor Department said on Friday that the producer-price index
(PPI), which measures the prices companies receive for goods and services, fell 0.2% in December, while the core prices, excluding volatile food and energy, rose 0.1%. Both figures were in-line with economists' forecasts. Analysts were expecting the PPI to remain weak, as crude oil prices are on the decline and the U.S. dollar stays strong.
Based on the weak December retail sales and industrial output, the Federal Reserve Bank of Atlanta trimmed its U.S. real GDP growth forecast for the fourth-quarter of 2015 to 0.6%, from a forecast of 1.8% right after the Fed rate hike. BNP Paribas turned sour on the U.S. economy, as the bank sees no U.S. GDP growth in the fourth-quarter. The strong dollar has reduced overseas demand for U.S. manufactured products. Some analysts, including Peter
Boockvar, chief market analyst at The Lindsey Group, told CNBC last month that "We're in manufacturing recession.”
The weak U.S. economic news sent the yield of the 10-year U.S. Treasury Note tumbling 5.02% to an intraday low of 1.986% on Friday, before bouncing back to close at 2.037%, while the U.S. 2-Year Treasury Note nosedived 5.56% to close at 0.85% on Friday. The yield spread between the 10-year and 2-year Treasury Notes printed at 1.18 percentage points, a level not seen since early 2008. The S&P 500 Financials sector got hammered another 3.05% this week, as the yield spread narrowed and the net interest margins declined.
Falling spreads may indicate worsening economic conditions in the future, resulting in a flattening yield curve. A very low or negative spread could signal an upcoming recession. Since 1960, each time that the yield spread went negative, a recession followed approximately 12-months later.
The S&P 500 Energy sector was down another 2.05% for the week, following the 6.69% plunge in crude oil prices on oversupply concerns and demand slowdown in China. The sanctions imposed on Iran came to an end and Iranian crude will start flowing again into the world market. Iran's Oil Minister Bijan Namdar Zanganeh said in November, at a news conference in Tehran, that Iran won’t negotiate with OPEC or seek the group’s permission before boosting oil exports by a planned 500,000 barrels per day (bpd) once sanctions are lifted.
The Fed's so-called "Dot Plot" is starting to look shaky, as the Federal Reserve Bank of San Francisco's Williams said on Friday that four rate hikes in 2016 are "not baked in the cake". St. Louis Fed President James Bullard turned less hawkish and said in his prepared remarks to the Economic Club of Memphis on Thursday that the latest plunge in crude prices has implications for monetary policy in the United States, according to CNBC.
The Federal Reserve seems to be rosy on the U.S. economy as their Beige Book, which is practically a summarized report on current economic conditions in each of the Fed’s 12 districts, said Wednesday that the U.S. economy expanded modestly across most regions in the past six weeks, except the New York and Kansas City Fed districts, which reported “essentially flat” economic activity. Wages and prices remained subdued in most of the U.S., while a strong U.S. dollar and slow growth overseas continued to stifle manufacturing activity in many areas.
According to the Commitment of Traders (COT) data released by the Commodity Futures Trading Commission (CFTC) for the week ended January 12, there are 119,267 short positions of S&P 500 consolidated futures, traded on the Chicago Mercantile Exchange (CME) by leveraged funds, a decrease of 6,232 short positions from the previous week. This is compared to about 64,766 long positions, down 520 from the previous week.
The data suggested that hedge funds have reduced their short positions resulting in an increase in a net long positions of 5,712 contracts, where contracts of S&P 500 futures are traded in units of $250.00 x S&P 500 index. During the same period, hedge funds increased their net short positions of light sweet crude oil futures, traded on the New York Mercantile Exchange (NYSE), by about 13,064 contracts, reflecting the headline news from the global financial markets.
The S&P 500 closed at 1,880.33 on Friday, down 2.17% for the week. The best performing S&P 500 sector for the week was Utilities, which was up 0.7%, while the worst performing sectors for the week were Financials and Materials, down 3.05% and 4.4%, respectively. The Utilities sector has lead the market for the second week in the row, up 0.3% for the year, compared to the S&P 500, which is down 8.0% during the same period. Money has rotated out of interest sensitive sectors into safe havens and dividend stocks.
In fact, the S&P 500 Utilities sector has outperformed the S&P 500 index by 12.48% over the past two years. That tells a lot about how Wall Street feels regarding the U.S. economy.
S&P 500 Summary: –8.0% YTD as of 01/15/16
Barclay Hedge Fund Index: +0.29% YTD
Outperforming Sectors: Utilities +0.30% YTD, Telecommunication services –3.13% YTD, Consumer staples –4.38% YTD, and Healthcare –7.2% YTD
Underperforming Sectors: Industrials –8.35% YTD, Consumer discretionary –8.62% YTD, Energy –8.75% YTD, Information technology –9.01% YTD, Financials –10.29% YTD, and Materials –11.88
YTD. |