|
The S&P 500 ran up a combined of 2.71% on Thursday and Friday, driven by the European Central Bank (ECB)’s hints for more monetary stimulus, the People’s Bank of China (PBoC) rate cut announcement and better-than-expected earnings results from tech bellwethers, including Alphabet [NASDAQ:GOOGL] and Microsoft [NASDAQ:MSFT]. For the week, the S&P 500 surged 2.07% to close at 2,075.15 on Friday. The yield of the U.S. 10-Year Treasury Note jumped 2.63% for the week to close at 2.087% on Friday, while the U.S. dollar index (DXY) bumped up 2.81% for the week to close at 97.243.
ECB President Mario Draghi said in the press conference after the ECB Governing Council meeting in Malta on Thursday that the bank will re-examine whether to extend its 1.1 trillion euro bond-buying program at its December 3 meeting. The ECB left key interest rates unchanged at 0.05% as Mr. Draghi sees downside risks to growth and the inflation outlook.
In fact, October business growth in the eurozone was surprisingly strong as Markit's Composite Flash Purchasing Managers' Index, a measure of activity in the manufacturing and services sectors based on surveys of over 5,000 companies across the eurozone, came in on Friday at 54.0 this month, up from September's 53.6, beating economists' forecast of a decline to 53.4. A reading above 50 indicates the expansion in the business sector.
The PBoC surprised the markets on Friday as the bank cut their benchmark interest rate and lending rate by 25 basis points. The PBoC said on its website that they will also cut the reserve requirement ratio (RRR) by 50 basis points for all banks, effective October 24. The move came after the National Bureau of Statistics on Monday said China’s economic growth slowed to 6.9% in the third-quarter of the year, the weakest quarter since the first quarter of 2009 during the global financial crisis.
Although the figure came in better than the growth forecast of 6.8% by economists at The Wall Street Journal, many believed that the actual growth could be one or two percentage points below the official figure. Other China economic data reported on Monday was industrial production, which grew 5.7% year-on-year, slower than the 5.9% growth expected. Fixed-asset investment came in below expectations at 10.3%, but retail sales match expectations with a 10.9% growth rate.
Last week, China’s General Administration of Customs said that Chinese exports fell 3.7% in September from a year earlier, in U.S. dollar terms, following a 5.5% drop in August. Chinese imports in September fell 20.4% from a year earlier, compared with a 13.8% decrease in August, while the trade surplus increased to $60.3 billion in September from $60.2 billion in August. Economists polled by Reuters had forecast Chinese exports to decline 6.3% and imports to fall 15%.
As of October 20, there are 183,184 short positions of S&P 500 consolidated futures, traded on the CME by leveraged funds, a decrease of 9,814 short positions from the previous week. This is compared to about 62,909 long positions, down 10,790 from the previous week, according to the Commitment of Traders (COT) data released by the Commodity Futures Trading Commission (CFTC) each Friday.
Hedge funds reduced both long and short positions during the week ending October 20 resulting in an increase of net short positions of 976 contracts, worth about $500 million, where contracts of S&P 500 futures are traded in units of $250.00 x S&P 500 index. Next week’s COT data could show that the hedge funds have pulled back some short positions ahead of the Fed meeting.
The best performing S&P 500 sectors for the week were Information technology and Industrials, which surged 4.61% and 3.84%, respectively. Alphabet and Microsoft shares, top constituents of S&P 500 Information technology, jumped 3.45% and 11.62%, respectively, after both companies announced their quarterly earnings reports that exceeded Wall Street expectations. Shares of both United Technologies Corporation [NYSE:UTX] and Boeing Co. [NYSE:BA], top constituents of S&P 500 Industrials, surged 8.28% and 6.7%, respectively, after reporting good quarterly earnings results and raising full-year guidance.
The worst performing S&P 500 sectors for the week were Energy and HealthCare, which were down 1.0% and 0.69%, respectively. The spot WTI crude oil price, traded on the Chicago Mercantile Exchange, tumbled 6.29% for the week to settle at $44.73 per barrel on Friday, after the U.S. Energy Information Administration said on Wednesday that U.S. commercial crude-oil inventories rose to 476.6 million barrels, up 8 million barrels in the week ending October 16. Analysts had expected an inventory build of 2.2 million barrels.
Shares of Valeant Pharmaceuticals Int’l Inc [NYSE:VRX] tanked another 34.78% for the week and took the S&P 500 Healthcare sector along with it after short-seller Citron Research issued a note on Wednesday, alleging that Valeant was shipping inventory to warehouses it controlled, then booking fictitious revenue. On Monday at 8:00 a.m. EST, Valeant will hold a conference call to respond to Citron Research's fraud accusations. Valeant has been criticized for acquiring companies and raising the prices of drugs in order to boost profits. We could see a surge in the HealthCare sector, about 14.57% weight on the S&P 500 index, if Valeant can dispute the Citron Research claims.
The S&P Healthcare sector was further rattled this week as Democratic presidential candidate Hillary Clinton sent letters on Monday to the Food and Drug Administration and the Federal Trade Commission and asked for investigations on what she called the, "egregious actions of Turing Pharmaceuticals,". The S&P 500 Biotechnology sub-sector has declined 4.43% since September 21, after Hillary Clinton went on a Twitter frenzy and sent out a tweet about “outrageous” price gouging by Turing Pharmaceutical's CEO.
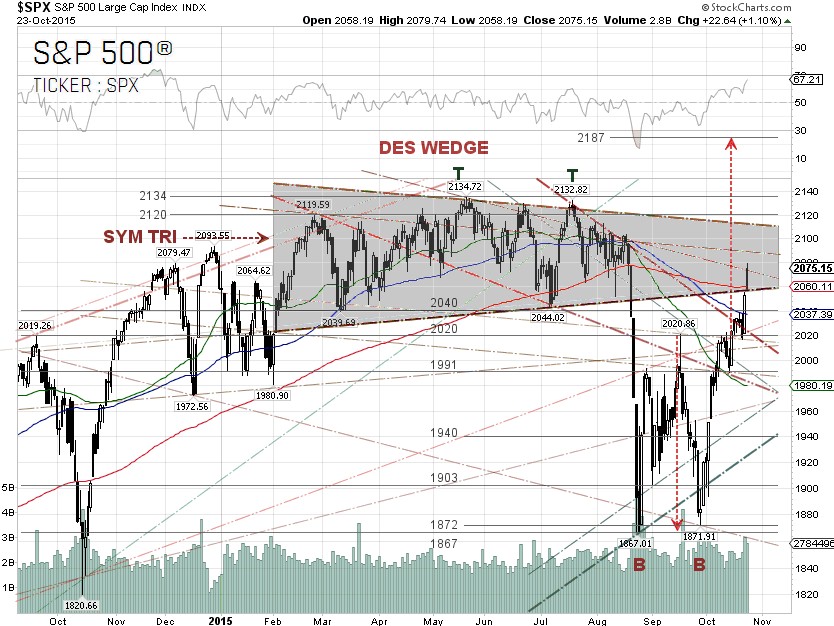
Technically, the S&P 500 broke out the bullish descending (DES) wedge chart pattern and closed above the 200-day SMA. The double bottom reversal is confirmed and the projected price for the S&P 500 is 2,187. The index has now broken back into the long-term symmetrical triangle (SYM TRI) chart pattern with the breakout point at 2,110.
The near-term headline risk is the October 27-28 U.S. Fed Meeting. A rate hike or hawkish comments out of this meeting could send a negative tone to the markets, as the U.S. and global economies have shown signs of weakening since the Fed's last meeting.
The federal funds futures, traded on the Chicago Mercantile Exchange and commonly used to estimate the market’s views on the likelihood of changes in U.S. monetary policy, indicate 6% odds for a quarter-point rate hike at the October 28 policy meeting, according to data from the CME Group as of October 23.
S&P 500 Summary: +0.8% YTD as of 10/23/15
Barclay Hedge Fund Index: –1.39% YTD
Outperforming Sectors: Consumer discretionary +10.29% YTD, Information technology +6.62% YTD, Consumer staples +4.25% YTD and Healthcare +1.08% YTD.
Underperforming Sectors: Industrials –2.44% YTD, Financials –2.5% YTD, Telecommunication services –2.52% YTD, Utilities –5.67% YTD, Materials –7.43% YTD and Energy –13.95%
YTD. |