|
The S&P 500 tumbled 1.62% to close at 1,958.03 on Friday, down 0.15% for the week, as the U.S. Federal Reserve decided to hold off a rate hike and maintain their zero interest rate policy after its Federal Open Market Committee (FOMC) Meeting on Thursday, noting the economic slowdown in China and emerging markets as the reason for the delay. The Federal Reserve also revised U.S. GDP to 2.1% for 2015, up from the June forecast of 1.9%, and downgraded the 2016 GDP to 2.3% from the 2.5% projection in June. The Federal Reserve now sees inflation back to 2% by 2017, or later.
The decision by the Federal Reserve not to hike the rate was widely expected as many Wall Street economists, including Barclays U.S. economists Michael Gapen and Rob Martin, projected the timing for the first Federal Reserve interest rate hike to be March 2016, citing volatile market conditions due to anxiety about the Chinese economy. According to data compiled by Bloomberg prior to the FOMC meeting, the odds of an increase in September had fallen this week to 26%, down from 40% when the survey was done at the end of July.
The Federal Reserve announcement sparked a relief rally in the bond market on Thursday and Friday sending the yield of the U.S. 10-Year Treasury Note tumbling 7.06%, closing on Friday at 2.134%. Since China’s “Black Monday”, bond traders have been selling U.S. Treasuries and drove the yield of the U.S. 10-Year Treasury Note up 20.89%, from the low of 1.905% on August 24 to a 2.303% intraday high on Wednesday. The U.S. dollar index (DXY) pulled back 0.91% to close at 94.677 on Thursday, and rose slightly on Friday to close at 94.996, a 0.21% decline for the week.
On October 1, when the 2016 fiscal year starts, the U.S. government will shut down unless Congress and the White House can agree on a bill that would keep money moving from the Department of the Treasury to the federal agencies and programs it funds. The U.S. debt ceiling deadline may also prevent the U.S. Federal Reserve to make any move until the Congress and the White House can agree on the terms of raising the nation’s debt limit, which could be between mid-November and early December or when the Treasury Department starts to run out of cash.
Federal-funds futures indicate only 16% odds for a rate hike at the October 2015 policy meeting, according to data from CME Group. The odds were 37% before the Federal Reserve announcement on Thursday and 50% a month ago.
To put the debt ceiling crisis into perspective, the last debt ceiling crisis in 2013 resulted in a 16-day partial government shutdown. That crisis began in January 2013, when the United States reached the debt ceiling of $16.394 trillion. As of Friday, September 18, 2015, U.S. debt has risen to $18.39 trillion. On January 20, 2009, the day President Obama was inaugurated, the federal debt stood at $10.62 trillion.
Earlier this week, the economic news from China was mixed as the National Statistics Bureau said Sunday that China’s fixed-asset investment rose 10.9% in the first eight months, missing the median forecast of 11.2% from economists surveyed by Bloomberg. China industrial production came in at a 6.1% gain year-on-year in August, trailing analysts' estimates of a 6.5% increase. One bright spot was retail sales, which rose 10.8% in August, beating the forecast of a 10.6% gain and July’s 10.5% rise.
The U.S. Commerce Department said on Tuesday that retail sales increased 0.2% month-on-month in August, after an upwardly revised 0.7% increase in July. Economists polled by Reuters had forecast retail sales increasing 0.3% in August, after a previously reported 0.6% rise in July. Separately, the Federal Reserve reported on Tuesday that U.S. manufacturing output fell sharply in August to 0.5%, after a rise of 0.9% in July.
The U.S. Labor Department said on Wednesday its Consumer Price Index (CPI) slipped 0.1% in August and rose 0.2% year-over-year. The core CPI, excluding food and energy, ticked up 0.1% month-over-month. Economists had forecast the CPI unchanged in August and rising 0.2% from a year ago.
As of September 15, there are 177,016 short positions of S&P 500 Consolidated Futures, traded on the Chicago Mercantile Exchange (CME) by leveraged funds, an increase of 1,296 short positions from the previous week. This is compared to about 78,523 long positions, down 4,247 from the previous week, according to the Commitment of Traders (COT) data released by the Commodity Futures Trading Commission (CFTC) each Friday.
The net short positions by hedge funds has increased by 5,543 contracts from the previous week, worth about $2.71 billion, where contracts of S&P 500 futures are traded in units of $250.00 x S&P 500 index.
The best performing S&P 500 sectors for the week were Utilities, Consumer staples and Healthcare, which climbed 2.51%, 0.82% and 0.77%, respectively. The worst performing S&P 500 sectors for the week were Materials and Telecommunication services, which were down 1.59% and 1.46%, respectively.
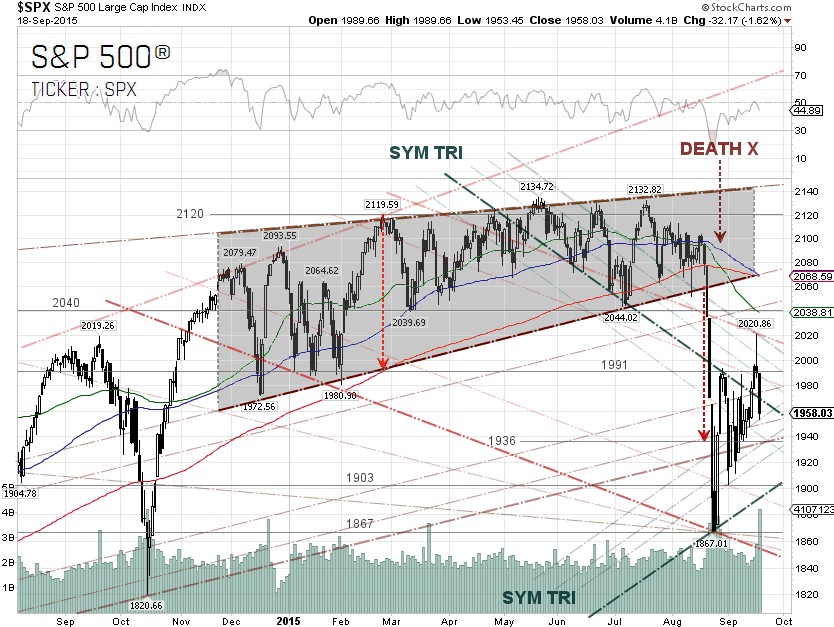
From our short-term technical viewpoint, the S&P 500 continues to move in a symmetrical triangle in the range between the 1,991 and 1,903 levels, since the index hit a low 1,867.01 on August 24. The uptrend pattern may be about to reverse, as a bearish Shooting Star emerged on Thursday, followed by a major sell-off on Friday.
The trading volume on Friday was heavy as it was quadruple witching, where individual stock options, stock futures, stock indexes and stock index futures expire simultaneously. According to the MarketWatch, over the last 25 years, the S&P 500 has declined in the week following September options expiration 21 times, with a median loss of 1.3%. In the event of a trend reversal, there are several supports between the 1,940 and 1,900 levels.
As three major moving averages, 50-, 100- and 200-day SMA, are turning downward, there will be selling pressures on the S&P 500 if these moving averages cross over each other. The sharp decline in the S&P 500 index in late August triggered a death cross, as the 50-day SMA fell below the 200-day SMA. The next crossover event is if the 200-day SMA crosses through the 100-day SMA at about the 2068 level.
S&P 500 Summary: –4.9% YTD as of 09/18/15
Barclay Hedge Fund Index: +0.22% YTD
Outperforming Sectors: Consumer discretionary +4.67% YTD, Healthcare +3.58% YTD, Information technology –2.29% YTD and Consumer staples –3.03% YTD.
Underperforming Sectors: Telecommunication services –6.21% YTD, Financials –8.26% YTD, Industrials –9.63% YTD, Utilities –10.68% YTD, Materials –13.72% YTD and Energy –21.17%
YTD. |