|
The S&P 500 closed at 2,065.30 on Friday, down 1.26% for the week, but up 1.05% year-to-date. The best performing S&P 500 sectors for the week were Utilities and Telecommunication services, which were up 2.24% and 1.14%, respectively. Money rotated into safe havens and dividend stocks, as weak U.S. economic data piled up. The worst performing sectors for the week were Information technology and Healthcare, which were down 3.58% and 2.95%, respectively.
Shares of technology companies, including Apple, Inc. (NASDAQ:AAPL), Alphabet, Inc.
(NASDAQ:GOOGL), and Microsoft Inc. (NASDAQ:MSFT) sold off after the companies reported earnings that missed Wall Street expectations. The Healthcare sector was under selling pressure after the Senate Special Committee on Aging conducted its third hearing on Wednesday, focusing on the drug price model of Valeant Pharmaceuticals
(NYSE:VRX) and three of its medications, Nitropress, Isuprel, and
Cuprimine.
As expected, the Federal Reserve decided at their FOMC meeting on Wednesday to keep the key interest rate unchanged at between 0.25% and 0.5%. The 10-year U.S. Treasury Note yield was 1.83% at the close on Friday, down 3.17% for the week. The yield spread between the 10-year and 2-year U.S. Treasury Notes closed at 1.06 percentage points on Friday, after dipping to 0.95 percentage point on March 8, a level not seen since late 2007. The U.S. dollar index tanked 2.16% to close on Friday at 93.03, below the technical support of 93.78, meaning there is more downside to come.
The U.S. economy may be faltering, as the advance estimate gross domestic product (GDP) for the first-quarter 2016, released by the Labor Department on Thursday, showed an increase at an annual rate of only 0.5%, the slowest since the first-quarter of 2014. More bad news came from the Commerce Department on Friday, as the core personal consumption expenditures
(PCE) price index, excluding food and energy, edged up only 0.1% in March, or at an annualized rate of 1.6%, well below the Fed inflation target of 2%. The Commerce Department also said consumer spending edged up just 0.1% in March, compared to an upwardly revised 0.2% gain in the previous month. The data suggested that U.S. consumers aren’t spending as much as most economists expected.
The Japanese yen surged against the U.S. dollar to close at 106.33 yen per dollar on Friday, with the exchange rate down 4.84% for the week, after the Bank of Japan
(BOJ) decided to keep its monetary policy on hold after a two-day board meeting on Thursday. Global markets were surprised with the BOJ’s decision, as Bloomberg reported on April 22 that the BOJ was considering to cut the interest on excess reserves
(IOER) deeper and offer negative rates to its lending program for financial institutions. That means the BOJ would be paying commercial banks to accept funding in an effort to boost lending and stimulate the economy.
In February, the BOJ introduced quantitative and qualitative monetary easing (QQE) with a negative 0.1% IOER of financial institutions placed at the bank. The BOJ also said it left the buying program of government bonds and exchange traded funds (ETFs) unchanged. Under the current QQE program introduced in April 2013, the BOJ buys 80 trillion yen per year in government bonds and 3.3 trillion yen of ETFs.
Since October 2015, the S&P 500 and WTI crude oil price are highly correlated with a coefficient of 0.9 over a 100-day period, where 1 is total positive correlation. The WTI crude oil spot price closed up another 5.12% for the week, at $45.99 per barrel on Friday, after closing up 4.79% the previous week. The key driver for the crude oil price for the week was the falling U.S. dollar, as fundamentals were a mixed bag.
The Energy Information Administration (EIA) weekly U.S. oil inventory report on Wednesday showed a build of 2 million barrels in the week ending April 22, compared to analysts’ expectations for a 1.75 million barrel build. The American Petroleum Institute (API) inventory data on Tuesday showed a 1.1 million barrel draw. The EIA also said the weekly U.S. crude oil production fell again for the thirteenth consecutive week, to 8.938 million barrels per day (bpd) for the week ending April 22, 2016, the lowest level since October 24, 2014, at 8.970 million bpd. Weekly U.S. crude oil output, however, has fallen 6.99% from the peak level of 9.61 million bpd during the week ending June 6, 2015.
More bullish news for the oil market came from Houston-based oilfield services company Baker Hughes Inc., who said on Friday that the U.S. oil rig count is now down another 11 to 332, a 79.4% drop from the peak number of 1,609 in October 2014.
Saudi Arabia currently set its crude oil price range at $20-$40 per barrel. The Kingdom's oil output may rise to 10.5 million bpd to record highs in the coming weeks to meet summer demand, said Reuters. Days before the Doha meeting, Saudi Arabia's top oil official, Deputy Crown Prince Mohammed bin Salman, said the kingdom could boost output immediately to 11.5 million bpd and go to 12.5 million bpd in six to nine months, according to Aljazeera.
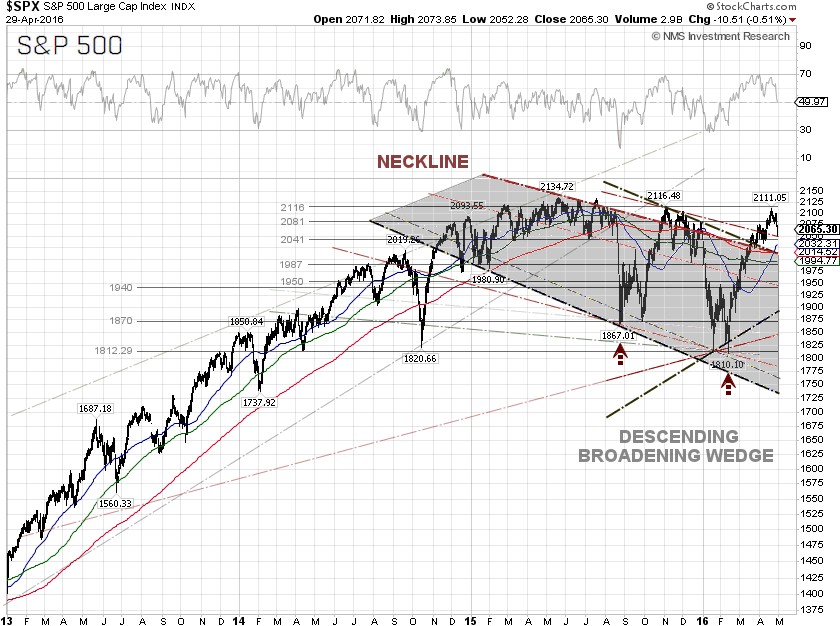
Technically, the S&P 500 pulled back and bounced off the trendline support at 2052.28. So far, earnings results were mixed, due in part to a strong U.S. dollar and weak demand aboard. Nonetheless, there is no reason to turn outright bearish yet, as a bullish golden cross, or the 50-day and 200-day SMA crossover, has now emerged. The next head resistance is at 2,116, while support is at 2,041.
S&P 500 Summary: +1.05% YTD as of 04/29/16
Barclay Hedge Fund Index: –0.84% YTD
Outperforming Sectors: Energy +12.04% YTD, Utilities +11.71% YTD, Telecommunication services +11.49% YTD, Materials +8.03% YTD, Industrials +5.2% YTD, Consumer staples +3.32% YTD and Consumer discretionary +1.25% YTD.
Underperforming Sectors: Financials –2.53% YTD, Healthcare –3.23% YTD and Information technology –3.42%
YTD. |