|
The S&P 500 closed at 2,091.58 on Friday, up 0.52% for the week and 2.33% year-to-date. The best performing S&P 500 sectors for the week were Energy and Financials, which were up 5.2% and 2.79%, respectively. The worst performing sectors for the week were Utilities and Consumer staples, which were down 3.23% and 2.13%, respectively. Investors and fund managers piled into the expensive energy and materials sectors, which drove the forward 12-month P/E of the S&P 500 to 17.80 times.
All eyes will be on the FOMC meeting next week since there wasn't much data from the economic front to move the markets, except the EIA Weekly Petroleum Status Report and the Weekly Unemployment Claims. One may want to pay attention to the S&P 500 index and WTIC correlation, as it is positively correlated, with a 100-day correlation coefficient of 0.91, meaning strong correlation.
The 10-year U.S. Treasury Note yield was 1.89% at the close on Friday, up 7.39% for the week. The yield spread between the 10-year and 2-year U.S. Treasury Notes closed at 1.05 percentage points on Friday, after dipping to 0.95 percentage point on March 8, a level not seen since late 2007. The U.S. dollar index
(DXY), a weighted index of the value of the U.S. dollar relative to a basket of six major currencies, closed up 0.41% for the week at 95.08.
The WTI crude oil spot price closed up another 4.79% for the week, at $43.75 per barrel on Friday, after closing up 5.27% last week. The Energy Information Administration
(EIA) weekly U.S. oil inventory report on Wednesday showed a build of 2.1 million barrels in the week ending April 15, compared to analysts’ expectations for a 2.4 million barrel build. The American Petroleum Institute (API) inventory data on Tuesday showed a larger build of 3.1 million barrels.
Traders shrugged off the bearish reports from Doha and Kuwait. The Doha oil meeting between OPEC and non-OPEC producers ended last Sunday without a deal to freeze production. Iran, which did not attend the meeting, said it will crank up their oil production even more, as the sanctions are now lifted. The state-run Kuwait Petroleum Corp. said on Wednesday that the strike by thousands of Kuwait oil workers was over. In the company statement released on Thursday, it said the daily production in Kuwait, OPEC's fourth largest producer, is now at 2.9 million barrels per day (bpd), slightly off the normal capacity of 3.0 million bpd.
The EIA said the weekly U.S. crude oil production fell again for the twelfth consecutive week to 8.953 million bpd for the week ending April 15, 2016, the lowest level since November 14, 2014, at 9.004 million bpd. Weekly U.S. crude oil output, however, has fallen by just 6.84% from the peak level of 9.61 million bpd during the week ending June 6, 2015.
More bullish news for the oil market came from Houston-based oilfield services company Baker Hughes Inc., who said on Friday that the U.S. oil rig count is now down another 8 to 343, a 78.7% drop from the peak number of 1,609 in October 2014. Obviously, there is no correlation between weekly crude oil production and the oil rig count.
According to the Commitment of Traders (COT) data released by the Commodity Futures Trading Commission (CFTC) for the week ended April 19, there are 144,044 short positions of S&P 500 consolidated futures, traded on the Chicago Mercantile Exchange by leveraged funds, an increase of 3,464 short positions from the previous week. This is compared to about 84,484 long positions, up 5,886 from the previous week.
The data suggests that hedge funds continued to be bullish and added more long positions than short positions into their portfolios, resulting in an increase in net long positions of S&P 500 consolidated futures by about 2,422 contracts, where contracts of S&P 500 futures are traded in units of $250.00 x S&P 500 index.
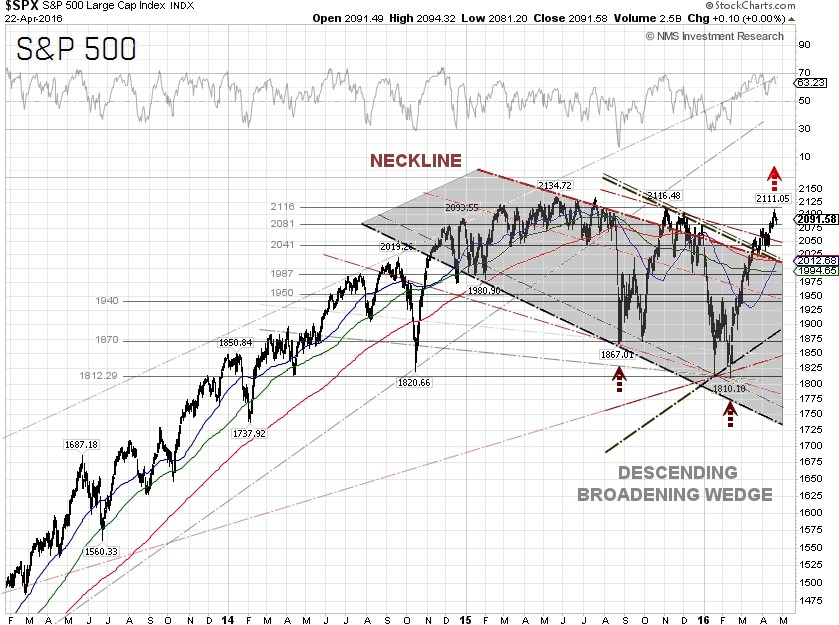
Technically, the S&P 500 traded in the range between 2,110 and 2,081 during the week. The index could have broken out the 2,116 level if the earnings results from Microsoft (NASDAQ:MSFT) and Alphabet (NASDAQ:GOOGL) were not that bad. Nonetheless, there is no reason to turn outright bearish yet, as a bullish golden cross, or the 50-day and 200-day SMA crossover, is now emerging. The next head resistance is at 2,116, while support is at 2,041.
S&P 500 Summary: +2.33% YTD as of 04/22/16
Barclay Hedge Fund Index: –0.86% YTD
Outperforming Sectors: Energy +11.49% YTD, Telecommunication services +10.23% YTD, Utilities +9.26% YTD, Materials +8.4% YTD, Industrials +5.7% YTD and Consumer staples +2.56% YTD.
Underperforming Sectors: Consumer discretionary +1.59% YTD, Information technology +0.17% YTD, Healthcare –0.28% YTD and Financials –1.29%
YTD. |