|
The risk-on trade was back after upbeat Chinese trade data on Wednesday, when the General Administration of Customs of China said that exports rose 11.5% in dollar terms in March, on year-on-year basis, while imports dipped just a slight 1.7%. The market expected an 8.5% increase in exports, according to The Wall Street Journal. The S&P 500 Financial sector surged after JPMorgan Chase
(NYSE:JPM) reported earnings that topped analyst estimates.
Investors shrugged off threats from the U.S. Presidential democratic socialist candidate, Bernie Sanders, who accused JPMorgan and others of destroying the fabric of America during his stump speeches and promised to break them up if he is elected.
U.S. economic data is still a mixed bag, as retail sales remain lackluster despite a strengthening labor market. The Commerce Department said on Wednesday that retail sales declined 0.3% in March, missing the forecast by economists polled by Reuters of a 0.1% increase. Core retail sales, excluding automobiles, gasoline, building materials and food services, were up just 0.1%, compared to the forecast of a 0.3% rise.
More bad news for the U.S. economy came from the Labor Department on Thursday, reporting that its Consumer Price Index (CPI) was 0.1% for March, missing the forecast of a 0.2% increase. Core CPI, excluding food and energy costs, rose 0.1%, the smallest increase since August. The Federal Reserve said on Friday that U.S. industrial production fell 0.6% in March, a decline in six of the last seven months. Economists polled by Reuters were expecting a decline of 0.1%.
The 10-year U.S. Treasury Note yield was 1.76% at the close on Friday, up 2.5% for the week. The yield spread between the 10-year and 2-year U.S. Treasury Notes closed at 1.02 percentage points on Friday, after dipping to 0.95 percentage point on March 8, a level not seen since late 2007. The U.S. dollar index
(DXY), a weighted index of the value of the U.S. dollar relative to a basket of six major currencies, closed up 0.47% for the week at 94.69. The DXY was testing the 94 level and could be the next shoe to drop if it closes below 94.
The WTI crude oil spot price closed up another 5.27% for the week, at $41.75 per barrel on Friday, after closing up 8.27% last week. The Energy Information Administration
(EIA) weekly inventory report on Wednesday showed a build of 6.6 million barrels in the week ending April 8, compared to analysts’ expectations for a 1.9 million barrel build. The American Petroleum Institute (API) inventory data on Tuesday also showed a build of 6.2 million barrels.
Traders shrugged off the bearish EIA weekly inventory report and turned their focus on the Doha OPEC meeting, a potential strike by thousands of Kuwait oil workers and the EIA U.S. field production data. Daily production in Kuwait, OPEC's fourth largest producer, is around 3.0 million barrels per day (bpd).
The EIA said the weekly U.S. crude oil production fell again for the eleventh consecutive week to 8.977 million bpd for the week ending April 8, 2016, the lowest level since November 14, 2014, at 9.004 million bpd. Weekly U.S. crude oil output, however, has fallen by just 6.59% from the peak level of 9.61 million bpd during the week ending June 6, 2015.
More bullish news came from Houston-based oilfield services company Baker Hughes Inc., who said on Friday that the U.S. oil rig count is now down another 3 to 351, a 78.2% drop from the peak number of 1,609 in October 2014. Obviously, there is no correlation between weekly crude oil production and the oil rig count.
According to the Commitment of Traders (COT) data released by the Commodity Futures Trading Commission (CFTC) for the week ended April 5, there are 140,580 short positions of S&P 500 consolidated futures, traded on the Chicago Mercantile Exchange by leveraged funds, a decrease of 5,765 short positions from the previous week. This is compared to about 78,599 long positions, down 3,829 from the previous week.
The data suggests that hedge funds continued to be bullish and trimmed some more short positions, resulting in a small increase in net long positions of S&P 500 consolidated futures by about 1,936 contracts, where contracts of S&P 500 futures are traded in units of $250.00 x S&P 500 index.
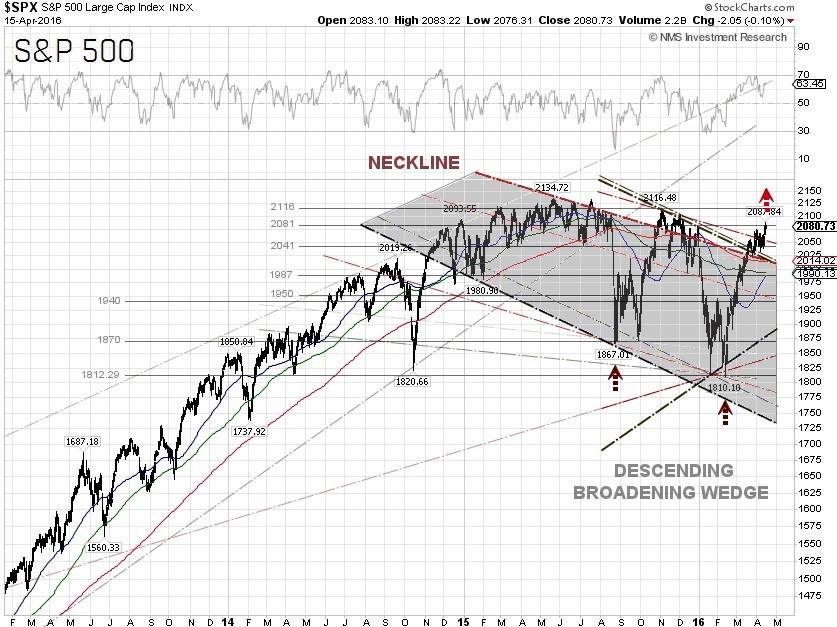
The S&P 500 closed at 2,080.73 on Friday, up 1.62% for the week and 1.8% year-to-date. The best performing S&P 500 sectors for the week were Financials and Materials, which were up 3.95% and 3.14%, respectively. The worst performing sectors for the week were Consumer staples and Telecommunication services, which were down 0.79% and 0.52%, respectively.
Technically, the S&P 500 continued to grind higher, but failed to break out the 2,081 resistance level. One may want to be cautious that the S&P 500 is losing some upside momentum. Nonetheless, there is no reason to turn outright bearish yet. The next head resistance is at 2,116 while support is at 2,041.
S&P 500 Summary: +1.80% YTD as of 04/15/16
Barclay Hedge Fund Index: –0.88% YTD
Outperforming Sectors: Utilities +12.91% YTD, Telecommunication services +11.61% YTD, Energy +5.98% YTD, Materials +5.74% YTD, Industrials +5.08% YTD, Consumer staples +4.79% YTD and Information technology +2.26% YTD.
Underperforming Sectors: Consumer discretionary +1.65% YTD, Healthcare –2.82% YTD and Financials –3.96%
YTD. |