|
The financial markets got a big surprise from the Obama administration, after the U.S. Treasury Department released new rules late Monday for the 60-40 split requirement that ultimately terminated the $160 billion merger between Allergan Plc. (NYSEADR:AGN) and Pfizer Inc. (NYSE:PFE). The news sent the S&P Healthcare sector tumbling 1.3% on Tuesday along with shares of Allergan, down 14.77%. Allergan CEO Brent Saunders struck back and called the new rules “un-American,”. The Treasury Department had previously proposed a 60-40 split requirement rule in November to derail the merger deal, but failed.
As CNBC Jim Cramer put it, “There is no law that says Allergan and Pfizer cannot do this. It was the lack of laws that allowed them to do it in the first place”. Pfizer is now be between a rock and a hard place, as sales stall for their flagship drugs, Lyrica and Viagra. The company may have to go back to their plan B, which is to break up the company into two smaller companies and layoff a whole bunch of workers to cut costs in order to compete in the free market.
There could be some signs of life in the U.S. non-manufacturing sector. The Institute for Supply Management (ISM) said on Tuesday that its index of March non-manufacturing activity rose to 54.5, barely exceeding expectations of 54.0 from a Reuters poll of 74 economists. A reading above 50 indicates expansion in the service sector. Keep in mind that one data point doesn’t make a trend, as the ISM non-manufacturing index just bounced off the low of 53.4 in February.
The S&P 500 was on a downtrend throughout the week on concerns about the weak global economy and that the Bank of Japan would push rates even deeper into negative territory. FX traders were speculating that the yen carry trade would unwind and sent the
USD/JPY exchange rate below the psychological support of 110 yen per dollar on Tuesday, a level not seen since November 2014. If global outlook worsens, the currency pair could dip below 108 yen per dollar, at which point the Japanese government may intervene. In early April however, Japanese Prime Minister Abe ruled out intervening in the currency markets to halt a surge in the yen.
The 10-year U.S. Treasury Note yield was 1.717% at the close on Friday, down another 4.08% for the week. The yield spread between the 10-year and 2-year U.S. Treasury Notes closed at 1.02 percentage points on Friday, after dipping to 0.95 percentage point on March 8, a level not seen since late 2007. The U.S. dollar index
(DXY), a weighted index of the value of the U.S. dollar relative to a basket of six major currencies, closed down 0.39% for the week at 94.25. The DXY was testing the 94 level and could be the next shoe to drop if it closes below 94.
The minutes of the March 15-16 U.S. Federal Open Market Committee meeting, released on Wednesday, revealed that many participants expressed concerns about appreciable downside risks of the global economic and financial situation, and that an April rate hike is unlikely. The European Central Bank
(ECB) minutes released on Thursday, also signaled that several council members were willing to consider a deeper rate cut in March, and that future rate cuts also remain on the table. This was in contrast to ECB President Mario Draghi’s statement after the March monetary policy meeting that the central bank doesn't anticipate that it will be necessary to reduce rates further.
The markets continue to be perplexed, as U.S. economic data is still a mixed bag while some Fed officials are still painting a rosy picture. The Commerce Department released February wholesale inventories data on Friday showing a worse-than-expected 0.5% decline, the biggest month-on-month drop in nearly three years. Weak wholesale inventories and consumer spending, along with other economic data, prompted the Federal Reserve Bank of Atlanta to revise their first-quarter 2016 GDP forecast to just 0.1% from the previous forecast of 0.4% on April 5.
According to Business Insider, GDP forecasts from blue chip companies, including J.P. Morgan, Barclays and Goldman Sachs, are taking their numbers for the first-quarter down to 0.2%, 0.3% and 0.9%, respectively.
The WTI crude oil price closed up 8.27% for the week, at $39.66 per barrel on Friday, after closing down 7.48% last week. The Energy Information Administration (EIA) weekly inventory report showed a draw of 4.94 million barrels, compared to analysts’ expectations for a 3.2 million barrel build, according to Thomson Reuters. The larger-than-expected draw could be attributed to the shutdown due to “small leak” of the Keystone crude pipeline that delivers oil to Cushing, which contributed to about 480,000 barrels at the Oklahoma delivery point for U.S. crude futures.
Traders were keeping an eye on the falling U.S. dollar, as the yen continues to surge and the April Fed rate hike becomes more and more unlikely. They were also encouraged by the EIA report, saying that weekly U.S. crude oil production fell for the tenth consecutive week to 9 million bpd (barrels per day) for the week ending April 1, 2016, the lowest level since November 14, 2014. Nonetheless, weekly U.S. crude oil output fell by just 6.35% from the peak level of 9.61 million bpd during the week ending June 6, 2015. Houston-based oilfield services company Baker Hughes Inc. reported on Friday that the U.S. oil rig count is now down to 354, a 77.8% drop from the peak number of 1,609 in October 2014. Obviously, there is no correlation between weekly crude oil production and the oil rig count.
According to the Commitment of Traders (COT) data released by the Commodity Futures Trading Commission (CFTC) for the week ended April 5, there are 146,345 short positions of S&P 500 consolidated futures, traded on the Chicago Mercantile Exchange by leveraged funds, an increase of 1,464 short positions from the previous week. This is compared to about 82,427 long positions, up 8,517 from the previous week. The data suggests that hedge funds became increasing bullish and added some more long positions, resulting in an increase in net long positions of S&P 500 consolidated futures by about 7,053 contracts, where contracts of S&P 500 futures are traded in units of $250.00 x S&P 500 index.
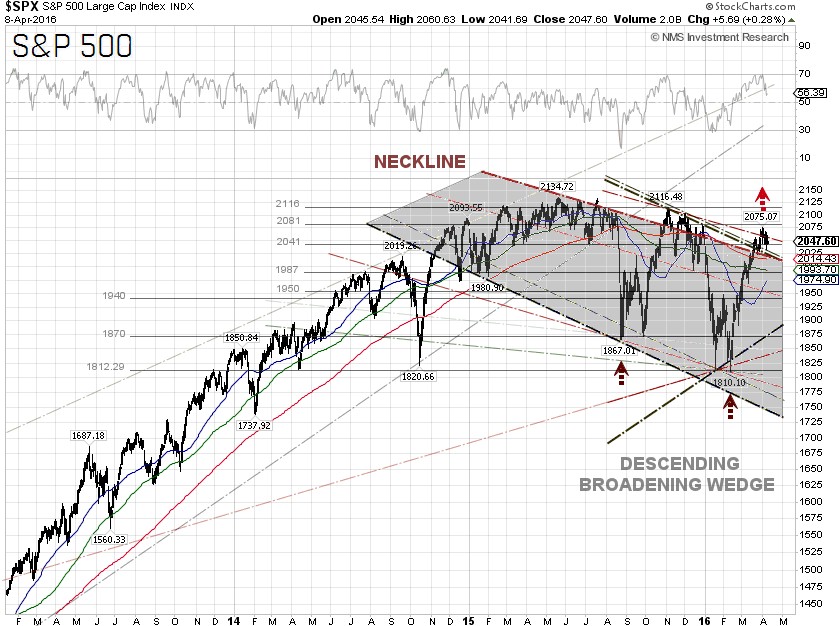
The S&P 500 closed at 2,047.60 on Friday, down 1.21% for the week. The best performing S&P 500 sectors for the week were Energy and Healthcare, which were up 2.2% and 0.89%, respectively. The worst performing sectors for the week were Telecommunication services and Financials, which were down 2.33% and 2.9%, respectively.
Technically, the S&P 500 failed to break out the 2,072 resistance level on Monday and retested the 2,041 support level. One may want to be cautious that the S&P 500 is losing some upside momentum. Nonetheless, there is no reason to turn outright bearish yet. First-quarter earnings reports will be in focus during the weeks ahead. According to a recent FactSet report, five sectors of the S&P 500 are projected to report year-over-year growth in revenues in the first-quarter 2016, led by the Telecom services and Healthcare sectors. Five sectors are predicted to report a year-over-year decline in revenues, led by the Energy and Materials sectors.
S&P 500 Summary: +0.18% YTD as of 04/08/16
Barclay Hedge Fund Index: –1.05% YTD
Outperforming Sectors: Utilities +12.69% YTD, Telecommunication services +12.2% YTD, Consumer staples +5.62% YTD, Energy +3.92% YTD, Materials +2.52% YTD, Industrials +2.95% YTD and Information technology +1.07% YTD.
Underperforming Sectors: Consumer discretionary –0.39% YTD, Healthcare –3.88% YTD and Financials –7.61%
YTD.
Disclosure: Long position in AGN and no recommendation. |