|
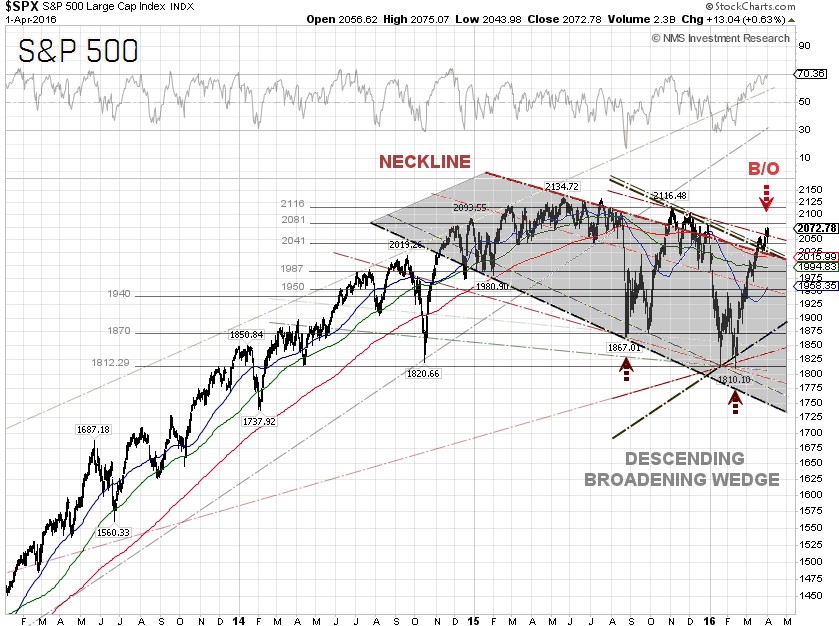
Front-running Republican presidential candidate Donald Trump told the Washington Post in an interview on Saturday that economic conditions are so perilous that the country is headed for a “very massive recession” and that “it’s a terrible time right now” to invest in the stock market, embracing a distinctly gloomy view of the economy that counters mainstream economic forecasts. The market seems to disagree with Mr. Trump though, as the S&P 500 just broke out the technical resistance and may be ready to move up another leg.
This year on a weekly basis, the S&P 500 is up more than 60% of the time. All sectors have outperformed the S&P 500, except for Healthcare and Financials. Healthcare has been under siege and became a soft target for both Democratic and Republican presidential primary campaigns, as high prescription drug costs are a hot-button issue. Investors in the Financial sector are running for the cover as Democratic Socialist presidential candidate Bernie Sanders has called for the breakup of large financial institutions, using campaign rhetoric such as “Too Big To Fail”. The sector is already under pressure as the yield curve is flattening.
In our opinion, the S&P 500 would be up 4-5% year-to-date if this wasn’t an election year. Politics will continue to cloud investors' outlook for the markets and downside risks for the S&P 500 could rise as the November general election approaches.
The markets are perplexed, as U.S. economic data is still a mixed bag while some Fed officials are still painting a rosy picture. The U.S. Commerce Department said on Monday that consumer spending in February edged up just 0.1%, while January spending was revised downward from a 0.5% increase to a 0.1% gain. In the 12 months through February, the personal consumption expenditures
(PCE) price index increased 1.0%, after rising 1.2% in January. The core PCE price index, excluding food and energy, prices gained 0.1% after advancing 0.3% in January. In the 12 months through February, the core PCE price index increased 1.7%, below the 2.0% Fed target for the 46th month, according to The Wall Street Journal.
Separately, the Commerce Department said the advance goods trade deficit widened to $62.9 billion in February from $62.2 billion, rising for a fourth straight month. The Atlanta Fed sharply cut the real GDP growth forecast on Monday for the first-quarter of 2016 to 0.6%, from 1.4%, after the release of the personal income and outlays report. The Wall Street consensus for the first-quarter GDP growth is now tracking at 0.9%.
The U.S. Labor Department said on Friday that there were 215,000 nonfarm payrolls jobs added in March, while Wall Street economists forecasted only 205,000 jobs. The unemployment rate rose to 5.0%, missing expectations of 4.9%. Nonfarm payrolls continued to trend down in the last 6 months and the unemployment rate may have bottomed at 4.9%.
The Institute for Supply Management (ISM) said on Friday that its manufacturing index rose to 51.8% last month, from 49.5% in February, compared to the 51.0% forecast of economists surveyed by
MarketWatch. Readings above 50% indicate more companies are expanding. Although the ISM manufacturing index continues to improve as the March ISM manufacturing indexes for new orders and production increased, employment still contracted at a more rapid pace. Therefore, nonfarm payrolls could continue to trend down in the coming months while the unemployment rate stays at or above 5.0%, since weak U.S. GDP and consumer spending persists.
The 10-year U.S. Treasury Note yield was 1.79% at the close on Friday, down 6.28% for the week. The yield spread between the 10-year and 2-year U.S. Treasury Notes closed at 1.03 percentage points on Friday, after dipping to 0.95 percentage point on March 8, a level not seen since late 2007. The U.S. dollar index (DXY), a weighted index of the value of the U.S. dollar relative to a basket of six major currencies, closed down 1.61% for the week at 94.62. The DXY could be the next shoe to drop if it closes below 94.
The WTI crude oil price closed down 7.48% for the week, at $36.63 per barrel on Friday, after another bearish Energy Information Administration (EIA) inventory report showed a build of 2.39 million barrels, compared to analysts’ expectations for a 2.0 million barrel build. Adding to the volatility was a comment from Saudi Arabia’s deputy crown prince, Mohammed bin Salman, in an interview with Bloomberg that his country will freeze its oil output only if Iran and other major producers agree to curb theirs.
Thus far, Iran said that they would attend the meeting between OPEC and non-OPEC producers in Doha on April 17 to discuss a deal to freeze output. It however, does not mean that Iran will take part in negotiations over production freezes, according to CNBC.
According to the Commitment of Traders (COT) data released by the Commodity Futures Trading Commission (CFTC) for the week ended March 29, there are 144,882 short positions of S&P 500 consolidated futures, traded on the Chicago Mercantile Exchange by leveraged funds, an increase of 2,658 short positions from the previous week. This is compared to about 73,910 long positions, up 1,990 from the previous week. The data suggests that hedge funds were undecided in what direction the market will move next. This resulted in an increase in net short positions of S&P 500 consolidated futures by about 668 contracts, where contracts of S&P 500 futures are traded in units of $250.00 x S&P 500 index.
The S&P 500 closed at 2,072.78 on Friday, up 1.81% for the week. The best performing S&P 500 sectors for the week were Information technology, Consumer staples and Consumer discretionary, which were up 2.73%, 2.63% and 2.51%, respectively. The worst performing sector for the week was Energy, which was down 1.26%. According to a recent FactSet report, five sectors of the S&P 500 are projected to report year-over-year growth in revenues in the first-quarter 2016, led by the Telecom services and Healthcare sectors. Five sectors are predicted to report a year-over-year decline in revenues, led by the Energy and Materials sectors.
Technically, the S&P 500 broke out the descending broadening wedge and the double bottom (at 1,867.01 and 1,810.10) chart patterns. There is a near-term trendline resistance at 2,061. One may want to be cautious though, as the RSI and MACD are near overbought levels.
The federal funds futures, traded on the Chicago Mercantile Exchange and commonly used to estimate the market’s views on the likelihood of changes in U.S. monetary policy, indicate just 5% odds for a rate hike at the Fed’s FOMC meeting on April 26-27, while the odds are 51% for the September 20-21 meeting, according to data from the CME Group as of April 1. The market signaled that the Fed’s next move is more likely at the September meeting.
S&P 500 Summary: +1.41% YTD as of 04/01/16
Barclay Hedge Fund Index: –0.26% YTD
Outperforming Sectors: Utilities +14.96% YTD, Telecommunication services +14.88% YTD, Consumer staples +6.16% YTD, Industrials +4.51% YTD, Materials +3.69% YTD, Information technology +3.05% YTD, Consumer discretionary +1.71% YTD, and Energy +1.69% YTD.
Underperforming Sectors: Healthcare –4.73% YTD and Financials –4.85%
YTD. |