|
The financial markets were rattled during the short-trading week after several of Fed Chair Janet Yellen’s dissenters started making noise. Here is how CNBC Senior Economics Reporter Steve
Liesman, put it, “Fed Chair Yellen has a mini revolt on her hands”. Federal Reserve Bank of St. Louis President James Bullard, one of the U.S. Federal Reserve's most prominent advocates of higher interest rates, looks like he now has second thoughts after telling Reuters in mid-February that it was "unwise" to move any further in light of weak inflation and global volatility.
Mr. Bullard now says that policymakers should consider raising interest rates at their next (April) meeting, amid a broadly unchanged economic outlook and prospects of inflation and unemployment exceeding targets, according to Bloomberg.
Just last week, the Fed kept the key interest rate unchanged at between 0.25% and 0.5% and hinted that they may make only two rate increases by the end of the year, half the number that was forecasted at its December meeting. The Fed also trimmed its economic growth outlook for the year to 2.2%, from the previous forecast of 2.4% growth, and its forecast for inflation to 1.2% from 1.6%.
The U.S. economy may be bouncing along the bottom at best. Therefore, the idea of the Fed talking up U.S. interest rates was not a good one to start with as panicked home buyers were forced to rush into the market while sellers were hiking up prices in anticipation that more people would be looking for houses. The National Association of Realtors said on Monday that sales of previously owned homes tumbled 7.1% in February from the prior month to a seasonally adjusted annual rate of 5.08 million. Economists surveyed by The Wall Street Journal had expected sales would fall 2.6% to a rate of 5.33 million in February.
New home sales in February were nothing to write home about. The U.S. Commerce Department said on Wednesday that sales rose 2.0% to a seasonally adjusted annual rate of 512,000 units, barely beating the 510,000 forecasted by economists polled by Reuters. Keep in mind that new home sales are based upon contract signings and account for only 9.2% of the housing market. While new single-family homes sales in the West saw a 38.5% surge, sales in the Northeast and Midwest, plunged 24.2% and 17.9%, respectively.
U.S. consumers are feeling less optimistic as rents, medical costs and gas prices are on the rise. The preliminary reading last Friday of the Index of Consumer Sentiment by the University of Michigan hit 90 in March, down from February’s reading of 91.7. Analysts’ expectations were for 92.2, according to the Thomson Reuters consensus estimates.
The Commerce Department said last Tuesday that January’s U.S. retail sales were revised sharply downward to a 0.4% decline, from the previously reported 0.2% increase. U.S. retail sales have shown signs of trouble since it peaked in March 2015 at 1.5% month-over-month growth. Following the data release, Barclays took their consumer spending forecast down to a 2.6% annualized rate from 3.3%, and cut its U.S. GDP forecast to 1.9% from 2.4%.
More mixed bags of economic data came from the Commerce Department, which said orders for durable goods, items ranging from toasters to aircraft meant to last three years or more, declined 2.8% last month after increasing 4.2% in January. Durable goods orders, which came in barely exceeding economists’ expectations for a 2.9% fall, according to Reuters, have decreased in three of the last four months. Core capital goods new orders, excluding transportation, dropped 1.0% and fell 1.9% without defense orders. Economists polled by Reuters had forecast orders for core capital goods slipping 0.1%.
Based upon the U.S. economic data this week, the Federal Reserve Bank of Atlanta revised their forecast on Thursday for real GDP growth in the first-quarter of 2016 to 1.4%, down from the previous forecast on March 16 of 1.9%.
The 10-year U.S. Treasury Note yield was 1.9% at the close on Friday, up 1.06% for the week. The yield spread between the 10-year and 2-year U.S. Treasury Notes closed at 1.02 percentage points on Friday, after dipping to 0.95 percentage point on March 8, a level not seen since late 2007. The U.S. dollar index (DXY), a weighted index of the value of the U.S. dollar relative to a basket of six major currencies, closed up 1.1% for the week at 96.17. The 61.8% Fibonacci retracement for the DXY is 96.27 and the near-term resistance is at about 97.08, or the 200-day SMA.
The WTI crude oil price closed down 3.74% for the week, below the $40 per barrel psychological level, after a bearish Energy Information Administration (EIA) inventory report showed a build of 9.36 million barrels, compared to analysts’ expectations for a 2.53 million barrel build. Adding to the volatility was the rollover from the April (CLJ6) to the May contracts (CLK6), and comments from the Fed’s Bullard.
According to the Commitment of Traders (COT) data released by the Commodity Futures Trading Commission (CFTC) for the week ended March 22, there are 142,223 short positions of S&P 500 consolidated futures, traded on the Chicago Mercantile Exchange by leveraged funds, a decrease of 2,175 short positions from the previous week. This is compared to about 71,920 long positions, down 11,398 from the previous week.
The data suggests that hedge funds turned bearish and trimmed a large number of long positions in their portfolios. This resulted in an increase in net short positions of S&P 500 consolidated futures by about 9,223 contracts, where contracts of S&P 500 futures are traded in units of $250.00 x S&P 500 index.
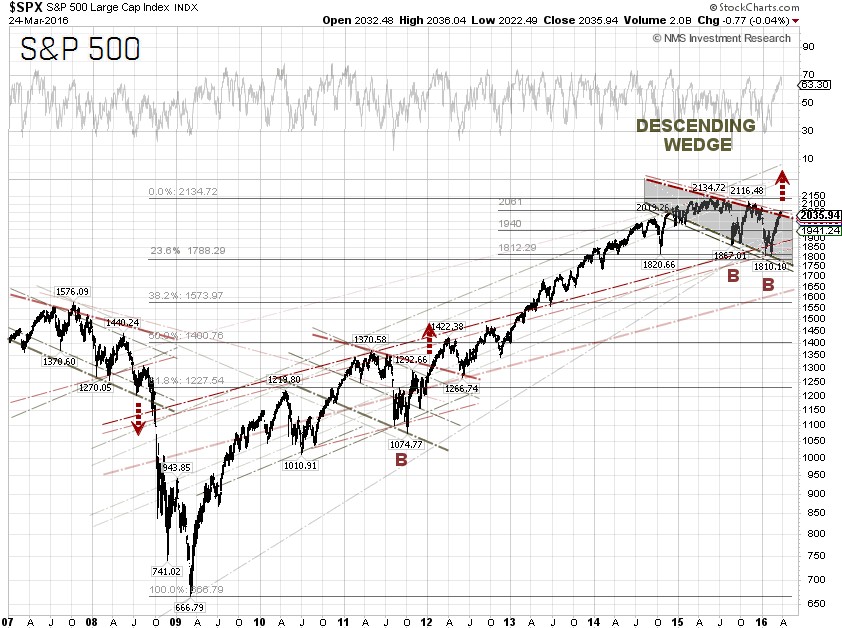
The S&P 500 closed at 2,035.94 on Friday, down 0.67% for the week, ending five straight weeks of gains. The best performing S&P 500 sectors for the week were Healthcare, Utilities and Telecommunication services, which were up 0.62%, 0.55% and 0.54%, respectively. Traders rotated out of the economically sensitive sectors into safe haven and high-dividend stocks. The Healthcare sector was the worst performing sector last week, and for the year-to-date, as fund managers are spooked by political rhetoric. The worst performing sectors for the week were Energy, Financials and Materials, which were down 2.43%, 1.87% and 1.65%, respectively.
Technically, the S&P 500 is about to break out the descending broadening wedge and the double bottom (at 1,867.01 and 1,810.10) chart patterns. There is a near-term trendline resistance at 2,061. One may want to be cautious though, as the RSI and MACD are near overbought levels.
The federal funds futures, traded on the Chicago Mercantile Exchange and commonly used to estimate the market’s views on the likelihood of changes in U.S. monetary policy, moved to 12% odds for a rate hike at the Fed’s FOMC meeting on April 26-27, while the odds are now 55% for the July 26-27 meeting, according to data from the CME Group as of March 24. The market signaled that the Fed’s next move is more likely at the July meeting.
S&P 500 Summary: –0.39% YTD as of 03/24/16
Barclay Hedge Fund Index: –3.33% YTD
Outperforming Sectors: Telecommunication services +13.94% YTD, Utilities +12.99% YTD, Industrials +3.54% YTD, Consumer staples +3.45% YTD, Energy +2.99% YTD, Materials +2.51% YTD and Information technology +0.32% YTD.
Underperforming Sectors: Consumer discretionary –0.78% YTD, Financials –6.41% YTD and Healthcare –6.47%
YTD. |