|
The S&P 500 sold off 1.85% on Friday, after the U.S. Department of Labor released its January non-farm payrolls report showing the economy added another 151,000 jobs last month, missing the economists' forecast for a 191,000 jobs gain. The unemployment rate dropped from 5.0% to 4.9%, as the civilian labor force increased from 157.83 million to 158.34 million, or an increase of 502,000. There is a huge gap, of about 351,000 jobs added, between the non-farm payrolls report and the unemployment rate for January. The gap was just 62,000 and 204,000 in November and December, respectively.
Most investors may not realize that the U.S. unemployment rate is calculated using the household survey data, while the non-farm payrolls number is derived from the so-called establishment survey. The Department of Labor deploys both the establishment survey and the household survey to collect their data.
The U.S. Department of Labor also said that January's average hourly wages increased again to a 2.5% annual growth rate, a slight slowdown from the prior month's 2.7% annual growth rate. Some economists explained that the higher wage growth was due to a "tightening labor market". It may be true, but some of the bump up could come from recent hikes in the minimum wage in many states and localities, affecting about 4.6 million workers.
Top Federal Reserve officials continued to send out mixed messages that moved the financial markets this week. Fed Vice Chairman Stanley Fischer, in remarks on Monday prepared for the Council on Foreign Relations in New York, signaled that he did not know the central bank's next move, even as concerns about the global outlook have grown and inflation continues to lag below expectations.
One day later, Kansas City Federal Reserve President Esther George, a voting member on the Fed's policymaking committee, said in prepared remarks before the Central Exchange in Kansas City, Missouri, that the central bank got a "late start" by raising its interest rate target in December, with more hikes to come. The recent market pain is not surprising or worrying, she added. Her remarks sent the WTI crude oil price tumbling 5.14% on Tuesday along with the S&P 500, which dipped 1.87%.
The U.S. dollar took a nosedive on Wednesday, following remarks from William C. Dudley, the president of Federal Reserve Bank of New York, in an interview with news service
MNSI, saying that the financial conditions have tightened since the Federal Reserve hiked rates in December and that could affect the Fed’s decision-making. On Thursday, Cleveland Fed President Loretta Mester said at a Market News International conference that volatility in financial markets, as well as deflationary pressures from the plunge in energy prices, shouldn't keep the U.S. central bank from raising rates.
Weak U.S. economic data has piled up since the Fed’s December meeting and the risk of the Fed losing its credibility has increased. The Institute for Supply Management said on Monday that the reading of their U.S. manufacturing index came in at 48.2, missing the median forecast of 48.4, according to a Bloomberg survey. A reading below 50 indicates contraction in the manufacturing sector. The data just confirmed that the U.S. manufacturing sector is in recession. The U.S. Commerce Department said last week that durable goods orders tumbled 5.1% in December, after declining 0.5% in November. Economists polled by Reuters had forecast durable goods orders to fall just 0.6% in December.
Separately, the U.S. Commerce Department said on Monday that personal income rose 0.3% in December, in line with economists’ estimates. Consumer spending came in flat, while the savings rate rose to a 3-year high of 5.5%. There is something wrong when U.S. consumers prefer saving over spending, despite the low unemployment rate, cheap gasoline prices and higher wage growth.
The remarks from Federal Reserve officials, weak corporate earnings and the mixed bag of U.S. economic data sent the yield of the 10-year U.S. Treasury Note down another 7.7% for the week, to close at 1.843% on Friday, while the yield of the U.S. 2-Year Treasury Note sank 6.17% for the week, to close at 0.73% on Friday. The yield spread between the 10-year and 2-year Treasury Notes printed at 1.12 percentage points on Friday, a level not seen since early 2008. The U.S. dollar index (DXY), a weighted index of the value of the U.S. dollar relative to a basket of six major currencies, tumbled 2.61% for the week, to close at 97.054 on Friday.
According to the Commitment of Traders (COT) data released by the Commodity Futures Trading Commission (CFTC) for the week ended February 2, there are 151,413 short positions of S&P 500 consolidated futures, traded on the Chicago Mercantile Exchange (CME) by leveraged funds, an increase of 7,458 short positions from the previous week. This is compared to about 62,672 long positions, a decrease of 11,969 from the previous week.
The data suggested that hedge funds cut back their long positions and increased their short positions, resulting in an increase in net short positions of S&P 500 consolidated futures by about 19,427 contracts, where contracts of S&P 500 futures are traded in units of $250.00 x S&P 500 index.
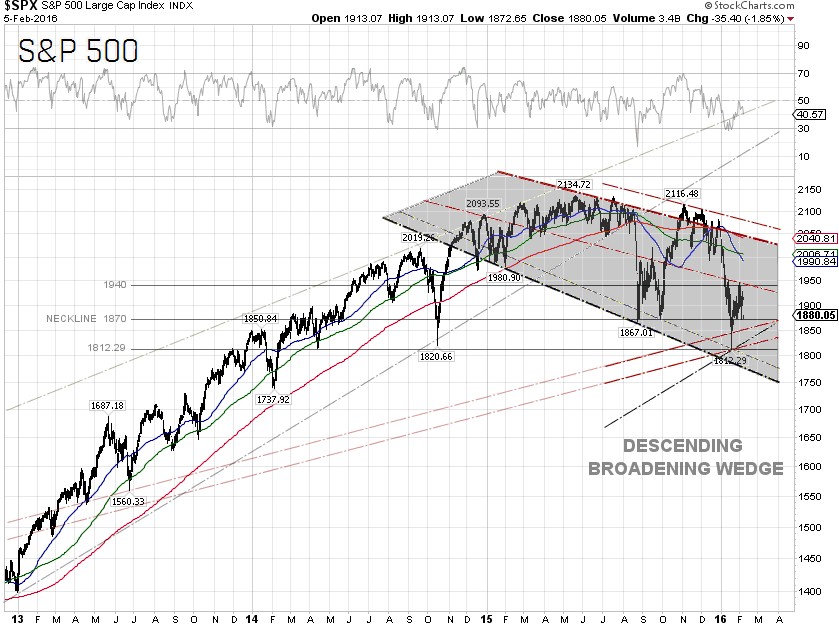
The S&P 500 closed at 1,880.05 on Friday, down 3.10% for the week. The best performing S&P 500 sectors for the week were Materials and Telecommunication services, which were up 4.76% and 2.52%, respectively. Dow Chemical Co. (NYSE:DOW), a top constituent of the S&P 500 Materials sector, surged 11.07% for the week. Freeport-McMoRan Inc (NYSE:FCX) skyrocketed 23.26% for the week, as the price of copper continued to rally on a weakening U.S. dollar. The worst performing sectors for the week were Consumer discretionary and Information technology, down 5.43% and 5.37%, respectively.
Technically, the S&P 500 has been moving in a descending broadening wedge chart pattern since early 2015. On January 20, the index retested the technical support at 1814.36, or the April 2014 low, and bounced off at 1,812.29 in heavy volume. The S&P 500 was unable to break out the key head resistance at 1,940 on Monday and was therefore in selling-mode throughout the week, as Federal Reserve officials continued their hawkish remarks.
A head and shoulders chart pattern has now emerged, with the neckline at 1,870. If the S&P 500 continues to pull back, the technical breakdown level for the descending broadening wedge chart pattern is at around 1,775. The S&P 500 could still be under selling pressure, as crude oil prices continue to be coupled with the index and we don’t see a WTI crude oil bottom until crude prices can close and stay above $37.75 per barrel.
S&P 500 Summary: –8.02% YTD as of 02/05/16
Barclay Hedge Fund Index: –2.26% YTD
Outperforming Sectors: Telecommunication services +7.65% YTD, Utilities +7.54% YTD, Consumer staples –1.82% YTD, Industrials –5.98% YTD, Energy –6.32% YTD, and Materials –6.36 YTD.
Underperforming Sectors: Information technology –10.0% YTD, Consumer discretionary –10.34% YTD, Healthcare –10.71% YTD, and Financials –12.32%
YTD. |