|
The S&P 500 started the week with a sell-off following a crash in the European markets, lead by the banking sector. Deutsche Bank CoCo (contingent convertible bond) holders finally learned what banking regulators meant by risk. In theory, the CoCo bonds are supposed to help troubled banks hang onto cash in times of stress by skipping coupon payments without defaulting, and converting the debt to equity or writing it down. Things turned out differently though, as the yield on Deutsche Bank CoCos rose to about 11.7% during the week, from 7.5% at the start of the year, after the bank posted heavy losses for 2015. The rising yield triggered a sell-off in Deutsche Bank stock, which spilled over to the entire European and U.S. banking sectors, and dragged down the global financial markets on Monday and Tuesday.
The sell-off continued on Wednesday and Thursday after Federal Reserve Chair Janet Yellen told the U.S. Congress during her two-day semiannual monetary policy report that overseas weakness and market distress could threaten the Fed's plans to raise the rate gradually this year and she was surprised by plunging crude oil prices. Ms.
Yellen, however, didn’t explicitly mention any delays to interest rate hikes during her testimony, meaning a March rate hike may be still on the table.
Concerns about global supply and weakening economies due to the Fed’s rate hikes, sent the spot price of WTI crude oil tumbling 15.97% from last Friday, to a 12-year low of $26.05 a barrel on Thursday. Short sellers covered their positions before the long U.S. holiday weekend and drove the WTI crude oil spot price up 6.3% to close at $29.02 a barrel on Friday, on speculation that the Organization of the Petroleum Exporting Countries (OPEC) was going to strike a deal over production. Shares of J.P. Morgan Chase & Co
(NYSE:JPM), Citigroup Inc. (NYSE:C), and Bank of America (NYSE:BAC) surged 8.33%, 7.32%, and 7.08%, respectively, on Friday, after news broke that J.P. Morgan Chase & Co. Chairman and Chief Executive James Dimon bought 500,000 of JPM shares on Thursday, worth about $26 million. Despite Friday's gains, shares of Citigroup and Bank of America were still down 5.82% and 7.80%, respectively, for the week.
The testimony of Fed Chair Yellen in front of Congress sent the yield of the 10-year U.S. Treasury Note down 5.26% for the week, to close at 1.746% on Friday. The chart pattern of the 10-year Treasury Note yield has technically broken down, while the yield spread between the 10-year and 2-year Treasury Notes dipped below 1 percentage point on Thursday for the first time since early 2008. The U.S. dollar index (DXY), a weighted index of the value of the U.S. dollar relative to a basket of six major currencies, tumbled another 1.1% for the week, to close at 95.982 on Friday.
According to the Commitment of Traders (COT) data released by the Commodity Futures Trading Commission (CFTC) for the week ended February 9, there are 139,568 short positions of S&P 500 consolidated futures, traded on the Chicago Mercantile Exchange (CME) by leveraged funds, a decrease of 11,845 short positions from the previous week. This is compared to about 67,303 long positions, an increase of 4,630 from the previous week.
The data suggests that hedge funds rotated back into their long positions and trimmed their short positions, resulting in an increase in net long positions of S&P 500 consolidated futures by about 16,475 contracts, where contracts of S&P 500 futures are traded in units of $250.00 x S&P 500 index.
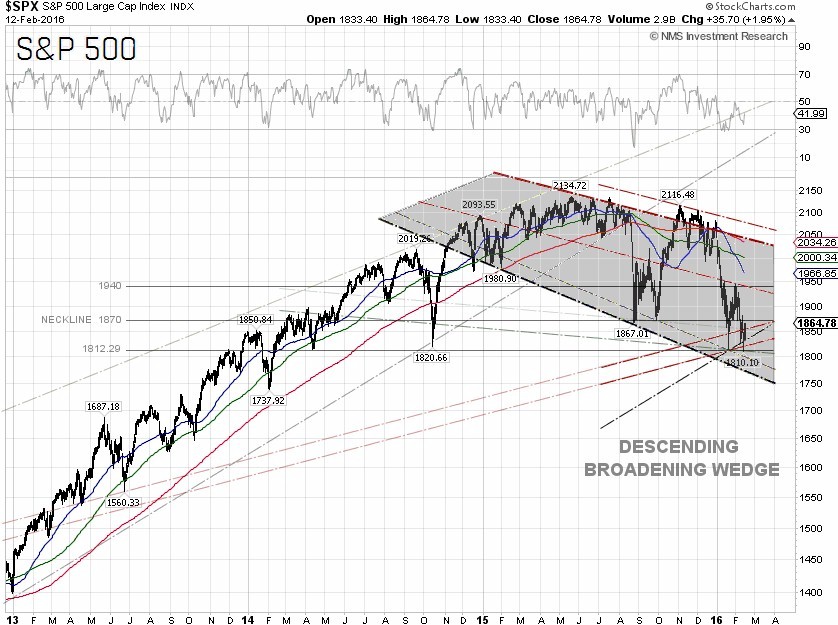
The S&P 500 closed at 1,864.78 on Friday, down 0.81% for the week. The best performing S&P 500 sectors for the week were Consumer staples and Healthcare, which were up 0.80% and down just 0.08%, respectively. The worst performing sectors for the week were Utilities and Materials, down 2.53% and 1.94%, respectively.
Technically, the S&P 500 was trading this week between 1,812.29 and the 1,870 level, or the neckline of a head and shoulders chart pattern. The bearish sentiment has increased significantly, as the Fed seems to be maintaining its aggressive rate hike path. The S&P 500 may continue to pull back to around the 1,775 level, or the lower trendline support of the descending broadening wedge chart, if the pessimism persists. As crude oil prices continue to be coupled with the S&P 500, there could be additional selling pressure to the index as we don’t see a WTI crude oil bottom until crude prices can close and stay at least above $37.75 per barrel.
S&P 500 Summary: –8.77% YTD as of 02/12/16
Barclay Hedge Fund Index: –2.66% YTD
Outperforming Sectors: Telecommunication services +6.36% YTD, Utilities +4.82% YTD, Consumer staples –1.03% YTD, Industrials –6.82% YTD, Energy –7.08% YTD, and Materials –8.17% YTD
Underperforming Sectors: Information technology –10.5% YTD, Healthcare –10.78% YTD, Consumer discretionary –10.91% YTD, and Financials –14.39%
YTD. |