|
The S&P 500 closed at 2022.19 on Friday, up 1.11% for the week, rising for the fourth week in a row. The best performing S&P 500 sectors for the week were Materials, Utilities and Energy, which were up 2.14%, 2.13% and 1.89%, respectively. The run-up in the Materials sector came after China’s Premier Li Keqiang announced a growth target range for this year of 6.5-7%, higher than many international economists had forecast, according to the Financial Times.
Investors are speculating that there will be more China stimulus, after the General Administration of Customs of China said on Monday that China's exports plunged 25.4% year-on-year in February, while imports declined 13.8%. According to Reuters, the sharp decline in exports in February was the steepest since May 2009, mainly due to weak global demand and a business shutdown during the Lunar New Year holiday. Analysts had expected a 12.5% drop in February exports, and a 10.0% decline in imports.
The WTI crude oil price surged 1.24% on Friday, another 5.95% for the week, after the Paris-based International Energy Agency
(IEA) said that oil prices might have bottomed as production declines in the U.S. and other non-OPEC producers accelerate and an increase in Iranian supply has been less than dramatic. Investors shrugged off the Short-Term Energy Outlook
(STEO) report, released by the U.S. Energy Information Administration
(EIA) on Tuesday, saying that there will be lower demand for crude oil in the next few years.
The EIA said it trimmed 2016 U.S. oil demand growth by 80,000 barrels per day, or bpd, from 110,000 bpd, and cut its 2016 worldwide demand growth forecast by 90,000 bpd to 1.15 million bpd. The EIA now expects WTI crude oil prices to average $34.04 a barrel in 2016, and $40.09 a barrel in 2017.
Jeffrey Currie, Goldman Sachs’ head of commodities research, issued a report on Tuesday saying that the recent rally in commodities is just a “mirage”, “premature” and “not sustainable,” according to
MarketWatch. As Mr. Currie put it in his report, “Energy needs lower prices to maintain financial stress to finish the rebalancing process; otherwise, an oil price rally will prove self-defeating as it did last spring,”
Investors rotated out of the rest of the economically sensitive sectors and into S&P 500 Utilities, as a safe haven trade since the yield spread between the 10-year and 2-year U.S. Treasury Notes is starting to break down. The yield spread dipped as low as 0.95 percentage point on Tuesday, a level not seen since late 2007. The next key technical support is at 0.86 percentage point, if the spreads continue to fall. Falling spreads may indicate worsening economic conditions in the future, resulting in a flattening yield curve.
The worst performing sectors for the week were Consumer discretionary and Industrials, up 0.57% and 0.48%, respectively. The performance of both sectors is closely related to the overall economy and is sensitive to economic cycles.
The European Central Bank (ECB) announced on Thursday, at the Governing Council meeting in Frankfurt, that the central bank raised monthly asset buys to 80 billion euros, from 60 billion euros, and cut its main refinancing rate to zero from 0.05%. It also cut its deposit rate by 10 basis points to -0.4%, and trimmed the marginal lending rate, used by banks to borrow from the ECB overnight, to 0.25% from 0.3%. The above-expectations QE came with a negative spin though, as ECB President Mario Draghi said after the ECB monetary policy meeting that the central bank doesn't anticipate that it will be necessary to reduce rates further.
According to the Commitment of Traders (COT) data released by the Commodity Futures Trading Commission (CFTC) for the week ended March 1, there are 150,837 short positions of S&P 500 consolidated futures, traded on the Chicago Mercantile Exchange by leveraged funds, an increase of 10,806 short positions from the previous week. This is compared to about 81,335 long positions, an increase of 10,931 from the previous week.
The data suggests that hedge funds are increasingly cautious and added almost equal amounts to their short and long positions, but still hold a large number of short positions in their portfolios. This resulted in an increase in net long positions of S&P 500 consolidated futures by about 125 contracts, where contracts of S&P 500 futures are traded in units of $250.00 x S&P 500 index.
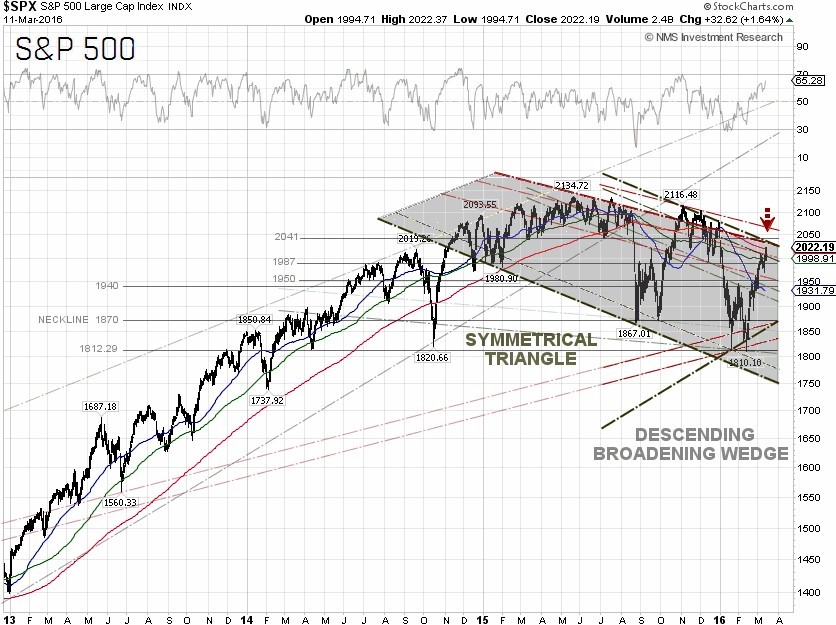
Technically, it is quite bullish that the S&P 500 managed to close above 2,019.92, or the 200-day moving average, for the first time this year. There are two near-term head resistances at 2,030, the breakout point for the symmetrical triangle chart pattern, and the 2,041 resistance level. The headline risk is the March 15-16 FOMC meeting. The federal funds futures, traded on the Chicago Mercantile Exchange and commonly used to estimate the market’s views on the likelihood of changes in U.S. monetary policy, climbed to 43% odds for a rate hike at the Fed’s FOMC meeting on June 14-15, while the odds jumped to 50% for the July 26-27 meeting, according to data from the CME Group as of March 12.
Since late October, crude oil prices have continued to be coupled with the S&P 500 and there could be additional selling pressure on the index if the crude prices can’t stay above $37.75 per barrel.
S&P 500 Summary: –1.06% YTD as of 03/11/16
Barclay Hedge Fund Index: –3.31% YTD
Outperforming Sectors: Telecommunication services +12.38% YTD, Utilities +10.47% YTD, Consumer staples +3.34% YTD, Energy +3.0% YTD, Materials +1.77% YTD, and Industrials +1.09% YTD.
Underperforming Sectors: Consumer discretionary –1.51% YTD, Information technology –1.93% YTD, Healthcare –5.12% YTD, Financials –6.03%
YTD. |