|
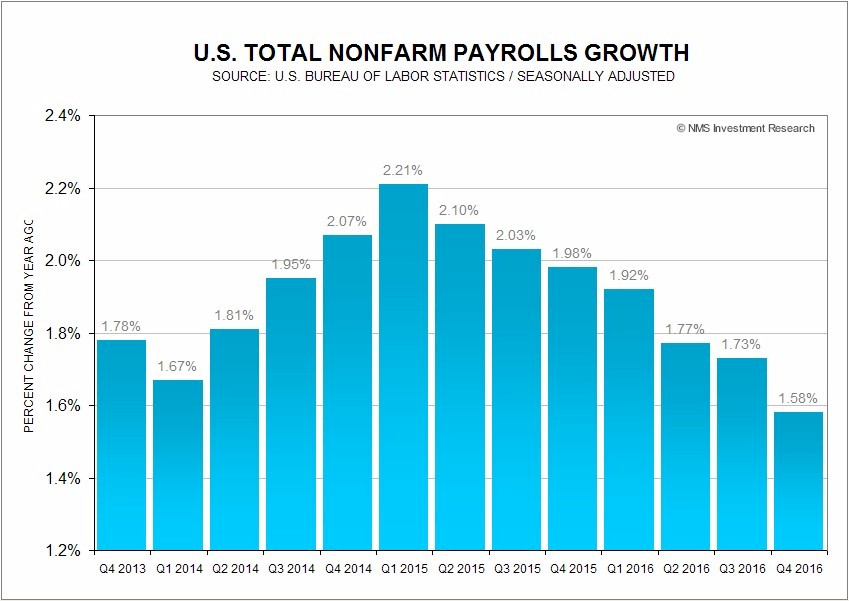
The U.S. unemployment rate inched up to 4.7% in December, as the civilian labor force participation rate ticked up to 62.7%, meaning some 95.1 million Americans are not in the labor force. The number of people who are not in the labor force but want a job now, decreased to 5.66 million in December from 5.88 million registered in November. Total nonfarm payrolls grew at 1.58% year-on-year, to 145.13 million in the fourth-quarter 2016, the slowest pace since the first-quarter 2013. One can argue that the slow growth in total nonfarm payrolls could be due to the lack of qualified workers, as the labor market approaches maximum employment.
As reported by MarketWatch, according to an analysis from Prattle, the Fed minutes of the December FOMC meeting released on Wednesday were the most hawkish in two years. The minutes revealed that the FOMC members thought they might have to be more aggressive in raising interest rates than the “gradual pace” that they have been signaling. The biggest risk to the outlook, according to Fed officials, was a continued drop in the unemployment rate.
The U.S. economic data continue to be mixed. The Institute for Supply Management (ISM) said on Tuesday its services index came in at 57.2% in December, exceeding economists’ forecast polled by MarketWatch of 57.1%. A reading above 50% indicates expanding activity. A similar survey by IHS Markit also showed the PMI rose to 54.3, the highest level since March 2015.
The Commerce Department said on Friday that U.S. factory orders declined 2.4% in November, missing the economists’ forecast polled by Reuters of a 2.2% decrease. The core capital goods, or non-defense capital goods orders excluding aircraft, were up 0.2% in November.
For the week, the U.S. Dollar index (DXY), essentially the USD/EUR exchange rate, closed at 102.27, practically unchanged for the week, after the People's Bank of China (PBoC) began cracking down on offshore yuan speculators, sending the yuan soaring against the U.S. dollar on Thursday and Friday. The yield of 10-year U.S. Treasury Notes declined 1.22% this week to close at 2.42% on Friday, while the yield spread between the 10-year and 2-year U.S. Treasury Notes narrowed to 1.20 percentage points. The 10-year JGB yield jumped 18.37% to 0.058% at the close on Friday, while the 10-year German bund yield surged 42.31%, to close at 0.296%.
The WTI crude price gained 0.50% for the week to close at $53.99 per barrel on Friday, while the Brent crude spot price remained practically unchanged, up $0.05 for the week, to close at $56.87 per barrel, despite a sharp drawdown in inventory. Oil companies use tax mitigation strategies at the year-end by keeping their crude cargo offshore rather than bringing them onshore. The WTI crude price continues trading around the $53.96 resistance level, or 76.4% Fibonacci retracement, as the market is in a wait-and-see mode for the OPEC and non-OPEC production cut of 1.8 million barrels per day (bpd), beginning in January 2017.
The EIA weekly U.S. oil inventory report on Thursday showed that domestic crude supplies decreased by 7.1 million barrels to 479.0 million barrels, excluding the Strategic Petroleum Reserve, in the week ending December 30, compared to S&P Global Platts forecast for a stockpile decline of 1.7 million barrels. The American Petroleum Institute (API) inventory data on Wednesday showed a U.S. crude inventory decrease of 7.4 million barrels.
Separately, the EIA said the weekly U.S. crude oil production dropped 4,000 bpd for the week ending December 30, to 8.766 million bpd. Weekly U.S. crude oil output has fallen about 8.74% from the peak level of 9.61 million bpd during the week ending June 5, 2015. Houston-based oilfield services company Baker Hughes Inc. said on Friday that the U.S. oil rig count inched up another 4 to 529, compared to 316, when the rig count hit the low on June 6, 2016.
|