S&P 500

S&P 500 Pulls Back As Crude Oil And U.S. Dollar Are In Trouble

Ed Wijaranakula, Ph.D.
Fri Mar 10, 2017

The S&P 500 lost 0.44% for the week, to close on Friday at 2,372.60, after six straight weeks of gains. The index is trading near the top of the ascending channel, with a 12-month+ target of 2,498. The best performing S&P 500 sectors for the week were Information technology ($SPT) and Healthcare ($SPHC), up 0.54% and 0.15%, respectively. The Healthcare sector crashed on Tuesday after President Trump sent out a tweet saying, “I am working on a new system where there will be competition in the Drug Industry. Pricing for the American people will come way down!”. The S&P 500 Information technology sector broke out its technical resistance at 750 in August and continues to move higher with a target for 12-months+ at 1,070.

The worst performing sectors for the week were Energy ($SPEN) and Real Estate ($SPRE), down 2.64% and 3.62%, respectively. Both sectors were under selling pressures after the release of bearish EIA weekly reports and news late last week that Hudson's Bay has failed to acquire equity financing for the takeover of Macy's (NYSE:M), hurting mall REIT stocks. 

The Federal Reserve Bank of Atlanta revised its U.S. first-quarter GDP 2017 estimate again on Wednesday, to 1.2% from 1.3%, citing weak inventory investment, after the Commerce Department said that wholesale inventories in January decreased 0.2%, the biggest drop since February 2016, following a 1.0% increase in December. Contradicting the Atlanta Fed, the Federal Reserve Bank of New York raised its U.S. first-quarter GDP forecast 0.1 percentage point this week to 3.2%, citing better-than-expected inventories, international trade, and labor market data. The U.S. Department of Commerce will release its advance estimate first-quarter GDP on April 28.

Despite the looming Fed rate hike next week, the U.S. Dollar index, or DXY, declined 0.43% for the week, to close at 101.11 on Friday. The index was unable to break through 102.16, or the 61.8% Fibonacci retracement level, for a second time on Thursday and could turn bearish, as a head and shoulders chart pattern has now emerged. In fact, the DXY dropped 0.60% on Friday despite that the U.S. Department of Labor said total nonfarm payrolls increased by 235,000 in February to a total of 145.798 million, compared to a revised 145.563 million in January, exceeding economists’ expectations for 197,000 jobs added. 

Some traders blamed the falling DXY on ECB president Mario Draghi, after he decided to keep interest rates unchanged on Thursday and commented that he isn’t worried about deflation anymore, but still thinks an accommodative monetary policy is needed. The current probability of a quarter percentage point hike, to the target Federal funds rate of 75 to 100 basis points, is 88.6% as of March 10, up 8.9 percentage points from last Friday, based on CME Group 30-Day Fed Fund futures prices. 

The yield of 10-year U.S. Treasury Notes jumped another 3.41% this week, to close on Friday at 2.575%, while the yield spread between the 10-year and 2-year U.S. Treasury Notes widened to 1.22 percentage points. The spot gold price dropped 2.01% for the week, to close at $1,201.40 per ounce on Friday, while the Japanese yen depreciated another 0.64% against the U.S. dollar.

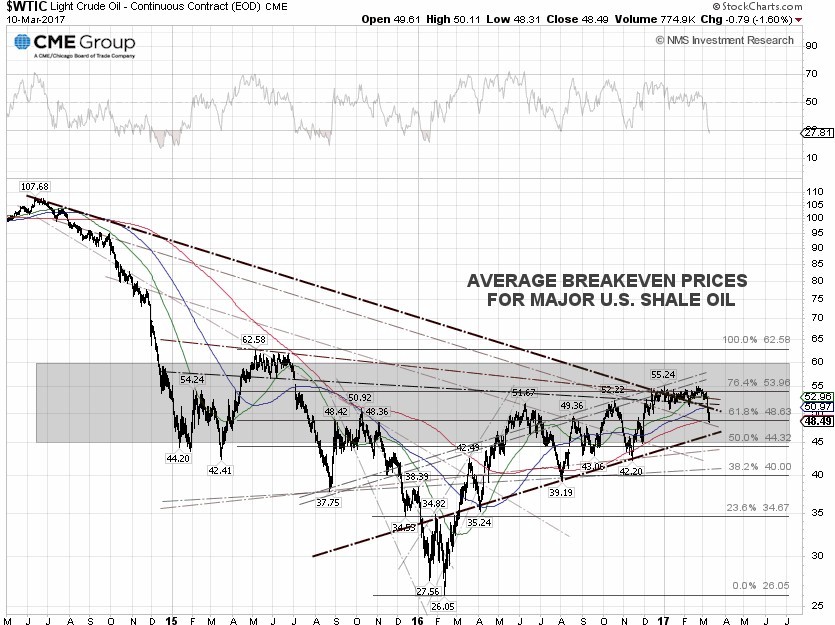
The WTI crude spot price tumbled 9.08% for the week, closing at $48.49 per barrel on Friday, while the Brent crude spot price plunged 6.87% for the week to close at $51.28 per barrel, after the WTI crude price broke down through the key 50-day SMA on Wednesday, triggering a cascade sell-off. Speculative long positions in WTI crude oil futures contracts held by money managers totaled 418,346 contracts as of March 7, 2017, a decline of 10,822 contracts, according to data from the U.S. Commodity Futures Trading Commission, or CFTC. Traders and analysts blamed the sell-off on the EIA weekly U.S. oil inventory report, showing the inventory at a record level for the fourth-straight week.

The EIA weekly U.S. oil inventory report on Wednesday showed that domestic crude supplies increased by another 8.21 million barrels to an all-time high of 528.39 million barrels, excluding the Strategic Petroleum Reserve, in the week ending March 3, compared to the S&P Global Platts forecast for a stockpile increase of 1.6 million barrels. The American Petroleum Institute, or API, inventory data on Tuesday showed a U.S. crude inventory increase of 11.6 million barrels. 

Separately, the EIA said the weekly U.S. crude oil production increased 56,000 barrels per day, or bpd, for the week ending March 3, to 9.088 million bpd. U.S. crude oil output increased 28,000 bpd to an average of 9.025 million bpd in March, compared to a February average of 8.997 million bpd. Output has fallen about 6% from the peak level of 9.60 million bpd in June 2015. Houston-based oilfield services company Baker Hughes Inc. said on Friday that the U.S. oil rig count rose another 8 to 617, compared to 316, when the rig count hit the low on June 6, 2016.

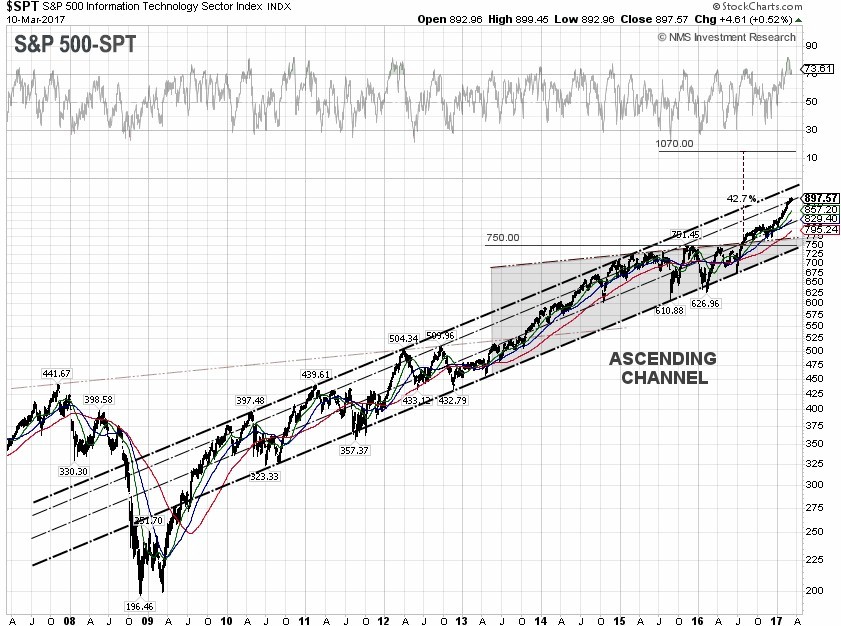
S&P 500 Summary: +5.97% YTD as of 03/10/17 
Barclay Hedge Fund Index: +2.41% YTD 

Outperforming Sectors: Information technology +11.09 YTD, Healthcare +9.97% YTD, Consumer discretionary +6.48% YTD, Financials +6.28% YTD, and Consumer staples +6.18% YTD.

Underperforming Sectors: Industrials +4.76% YTD, Materials +4.55% YTD, Utilities +4.12% YTD, Real Estate –0.48% YTD, Telecommunication services –3.65% YTD, and Energy –8.00% YTD.

S&P 500 ANALYSIS

Most Recent Articles  |  Older Articles            

 Infotix Systems, Inc. - NMS (Not Main Street) Research - privacy & security policy
All rights reserved