|
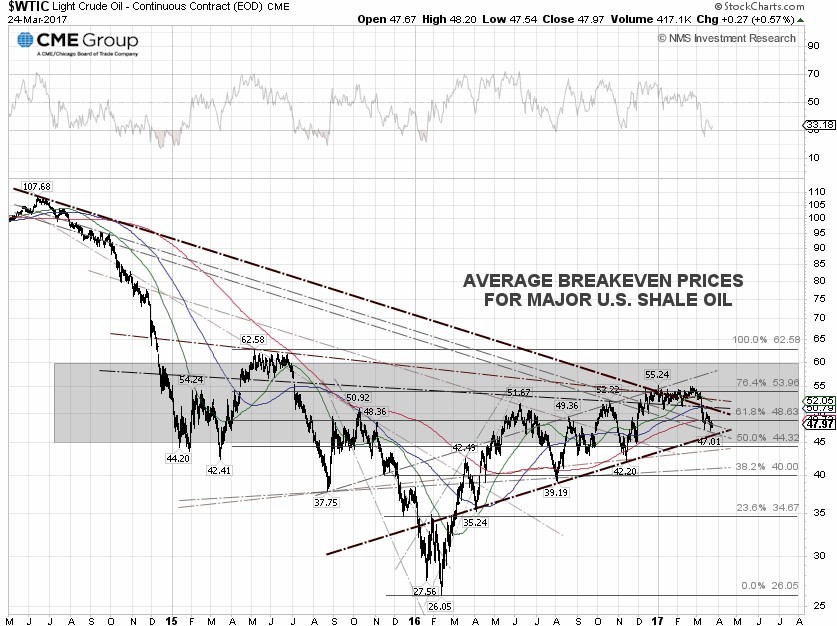
The WTI crude spot price tumbled 2.72% for the week, closing at $47.97 per barrel on Friday, while the Brent crude spot price was down 1.24% for the week to close at $51.12 per barrel, after a bearish EIA weekly report. WTI crude prices dipped below the 200-day SMA on Tuesday following a research note from Goldman Sachs saying that 2017-19 is likely to see the largest increase in history for mega projects' production, as the record 2011-13 capex commitment yields fruit, meaning a possible record for non-OPEC production growth in 2018.
The crude price got some support on Thursday after a Reuters report said that in February, the Saudis cut about 300,000 barrels per day, or bpd, of crude oil exports to the U.S. in line with OPEC's agreement to reduce supply. TransCanada Corp. (NYSE:TRP) announced on Friday that the U.S. Department of State signed and issued a Presidential Permit to construct the Keystone XL Pipeline, which would bring more than 800,000 bpd of heavy crude from Canada's oil sands in Alberta into Nebraska.
Short positions in WTI crude oil futures contracts held by producers or merchants are on the rise again and totaled more than 677,811 contracts as of March 21, 2017, about 25,619 contracts away from a record high, according to data from the U.S. Commodity Futures Trading Commission, or CFTC. Crude oil producers could take short hedge positions to lock in a future selling price to protect against a falling crude oil price. Some banks also require producers to hedge against future price risks as a condition for lending.
The EIA weekly U.S. oil inventory report on Wednesday showed that domestic crude supplies increased by 4.95 million barrels to an all-time high of 533.11 million barrels, excluding the Strategic Petroleum Reserve, in the week ending March 17, compared to the S&P Global Platts forecast for a stockpile increase of 2 million barrels. The American Petroleum Institute, or API, inventory data on Tuesday showed a U.S. crude inventory increase of 4.5 million barrels.
Separately, the EIA said the weekly U.S. crude oil production increased 20,000 bpd for the week ending March 17, to 9.129 million bpd. U.S. crude oil output increased 112,000 bpd to an average of 9.109 million bpd in March, compared to a February average of 8.997 million bpd. Output has fallen about 5.12% from the peak level of 9.60 million bpd in June 2015. Houston-based oilfield services company Baker Hughes Inc. said on Friday that the U.S. oil rig count rose another 21 to 652, compared to 316, when the rig count hit the low on June 6, 2016.
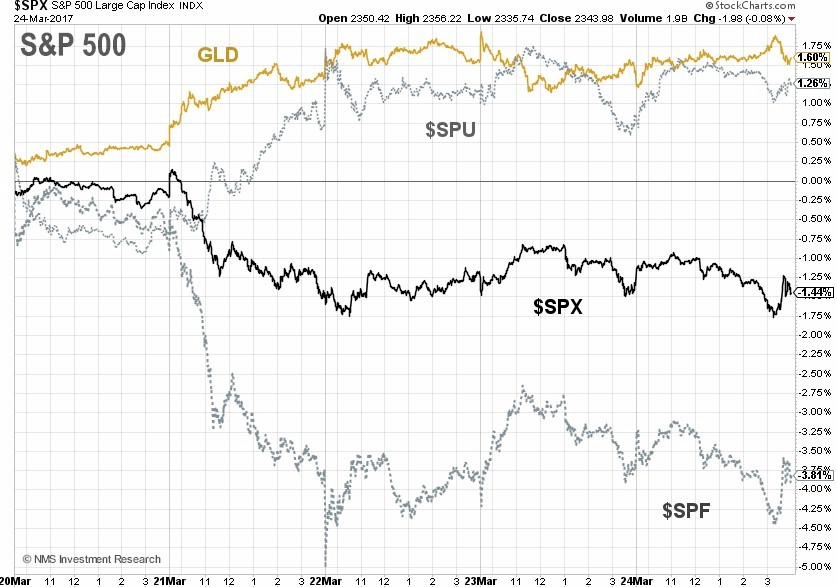
S&P 500 Summary: +4.70% YTD as of 03/24/17
Barclay Hedge Fund Index: +2.48% YTD
Outperforming Sectors: Information technology +10.97 YTD, Healthcare +7.74% YTD, Utilities +6.77% YTD, Consumer discretionary +6.33% YTD, and Consumer staples +5.77% YTD.
Underperforming Sectors: Materials +3.92% YTD, Industrials +3.08% YTD, Real Estate +1.92% YTD, Financials +1.25% YTD, Telecommunication services –4.30% YTD, and Energy –9.30%
YTD. |