|
Crude oil futures for delivery in February 15 [CLG15.NYM] closed on the last day of the year on the New York Mercantile Exchange (NYMEX) at U.S. $53.71 per barrel, the worst year for oil since 2008 as the price of WTI crude tumbled 45.58% for the year. Natural gas didn’t fare much better as the price of natural gas fell as much as 31.21% in 2014.
Natural gas could be the next shoe to drop as the natural gas futures for delivery in February 15 [NGG15.NYM] on the NYMEX closed on Wednesday at U.S. $2.91 per million Btu (mm Btu) as unseasonably warm weather in the U.S. Midwest and central Europe persist. The next technical supports for natural gas are 2.64 and 2.41 per mm Btu.
Greek Deputy Energy Minister, Makis Papageorgiou, said last month that there is a three-month delay between natural gas prices and crude oil prices. That means natural gas prices could continue falling another 20% in the first quarter of 2015, even if crude oil prices begin to stabilize. Greece owns a 9% share of the fleet of ships, or about 36 vessels, that transport liquefied natural gas (LNG) around the globe.
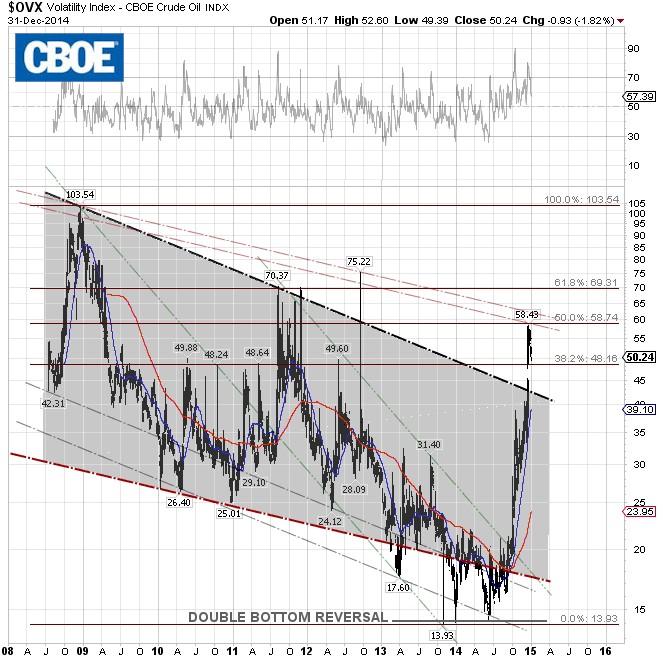
From a technical viewpoint, there was a warning sign that crude oil prices could be in serious trouble after the CBOE Crude Oil Volatility Index (OVX) made a confirmed double bottom reversal in October of last year. The OVX broke out of the 5-year falling wedge in mid-November 2014 and hit the two-year high on December 16 before pulling back from the 58.43 technical resistance level, or ~ 50% Fibonacci retracement.
The OVX, traded on the Chicago Board Options Exchange (CBOE), closed at 50.24 on December 31, up 182.88% for the year. If the OVX continues to fall, the next technical support is ~ 48, or 38.2% Fibonacci retracement. As the chart history speaks for itself, OVX could remain at elevated levels for months before pulling back. Our take is that crude oil prices could be heading lower if the OVX continues to trade between the 38.2% and 50% Fibonacci retracement levels.
Just a reminder, OVX measures the market’s expectation of 30-day volatility of the United States Oil Fund ETF [NYSE:USO]. Since the USO ETF invests primarily in the near month WTI crude oil futures contracts traded on the NYMEX, OVX itself is a crude oil derivative. High OVX readings usually mean traders see significant risks that crude oil price futures will move sharply lower.
If the crude oil and energy sector goes, so goes the market. |