|
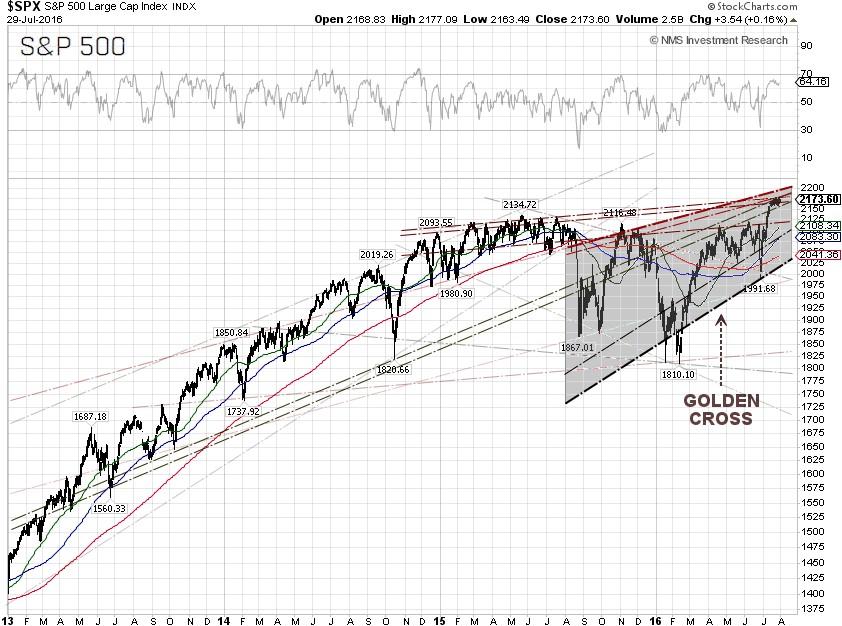
The S&P 500 inched down 1.43 points during the busiest week of the year filled with market moving economic events, to close at 2,173.60 on Friday, despite that the WTI crude oil spot price continued to tumble due to weak demand and oversupply. The S&P 500 index has decoupled from WTI crude prices since June 24, after the Brexit vote, as traders continue to rotate out of the Energy sector and pile into the Information technology and Healthcare sectors.
The best performing S&P 500 sectors for the week were Information technology, and Healthcare, up 1.55%, and 0.33%, respectively. The worst performing sectors for the week were Energy and Consumer staples, down 2.08% and 1.48%, respectively.
Japan's prime minister Shinzo Abe unveiled a surprisingly large 28 trillion yen (U.S. $265 billion) fiscal package on Wednesday to boost the faltering Japanese economy, following circulating rumors last week of a government spending supplement to the fall budget. The market response was mixed, as the plan didn’t specify the time frame for the outlays, so this may take place over the next few years.
The U.S. Federal Reserve concluded its two-day FOMC meeting on Wednesday without a rate hike, while releasing a policy statement saying that the Fed has increasing confidence in the improving labor market and the ability for inflation to move toward its 2% annual target. The Fed also said, “Near-term risks to the economic outlook have diminished.”, meaning further rate hikes could be on the table.
The market got a big surprise after the U.S. Bureau of Economic Analysis released the second-quarter GDP (advance estimate) on Friday, showing a disappointing GDP of 1.2%. So far this year, the U.S. economy is growing at about a 1% annual rate, the worst first-half performance since 2011. GDP growth was revised down to a 0.8% pace in the first-quarter, from 1.1%. Growth also was revised downward for the fourth-quarter of 2015 to 0.9%, from 1.4%.
In fact, the market might have already gotten a hint that more bad news about the U.S. economy was coming, as the Census Bureau's new advanced economic indicators report showed the advance goods deficit rose 3.7% to $63.3 billion last month, due to imports outpacing export growth. Wholesale inventories were unchanged, while stocks at retailers increased 0.5%. Weak advance goods trade and inventories data prompted the Atlanta Federal Reserve to knock down its second-quarter GDP by 0.5 percentage points, to a 1.8% annualized rate from a previous 2.3% pace.
Separately, San Francisco Fed President John Williams told the audience at the Milken Institute Global Conference in Beverly Hills on Friday that the second-quarter GDP reading was weak because of swings in inventories and government spending, noting that some underlying data in the report "look good."
The probability of a 25 basis point rate hike at the next FOMC meeting on September 21 tumbled 6 percentage points to 12.0%, while the probability of a no rate hike jumped to 88.0% from 82.0%, according to data from the CME Group as of July 29.
The dollar bulls ran for cover as the U.S. Dollar index tumbled 2.08% for the week, to close on Friday at 95.491. The Bank of Japan (BOJ) disappointed the market on Friday when they did not announce any government bond buying or further cuts in interest rates after their policy meeting, but said the bank will increase purchases of exchange-traded funds to raise its balance sheet to an annual pace of 6 trillion yen, from 3.3 trillion yen previously. The BOJ move sent the USD/JPY exchange rate tanking 3.71% for the week.
The yield of 10-year U.S. Treasury Note is heading back to test the record low of 1.37% on July 8, to close at 1.46% on Friday. The yield spread between the 10-year and 2-year U.S. Treasury Notes took a nosedive another 8.14% for the week, to close at 0.79 percentage points. The global bond markets continued to be rattled from global uncertainty, as the 10-year Japanese government bond (JGB) yield stayed at negative 0.182% at the close on Friday, while the 10-year German bund yield is back to negative 0.122%.
The WTI crude oil spot price tumbled another 5.86% for the week to close on Friday at $41.60 per barrel, while the Brent crude price took a 5.31% nosedive to close at $43.32 per barrel, following another bearish report from the Energy Information Administration (EIA) showing a larger-than-expected build in crude oil inventory stockpiles and weak U.S. demand for gasoline. About 50% of total U.S. liquid fuels consumption is gasoline.
The EIA weekly U.S. oil inventory report on Wednesday showed an increase of 1.7 million barrels to 521.1 million barrels, excluding strategic inventories, in the week ending July 22, compared to S&P Global Platts analysts’ expectations for a drawdown of 2.6 million barrels. The American Petroleum Institute (API) inventory data on Tuesday showed a U.S. crude inventory draw of 827,000 barrels for the week.
There was another large build last week in U.S. gasoline supplies of 500,000 barrels, while distillate stockpiles, including jet fuel, diesel fuel and heating oil, fell by 800,000 barrels, according to the EIA. Analysts were expecting a drawdown of the gasoline stocks of 700,000 barrels and a rise of 400,000 barrels for distillates.
Separately, the EIA said the weekly U.S. crude oil production jumped by 21,000 barrels per day (bpd) for the week ending July 22, 2016, to 8.515 million bpd. Weekly U.S. crude oil output has fallen about 11.39% from the peak level of 9.61 million bpd during the week ending June 6, 2015. Houston-based oilfield services company Baker Hughes Inc. said on Friday that the U.S. oil rig count was up another 3 from the previous week, to 374, compared to 316, when the rig count hit the low on June 6.
S&P 500 Summary: +6.34% YTD as of 07/29/16
Barclay Hedge Fund Index: +0.66% YTD
Outperforming Sectors: Telecommunication services +21.85% YTD, Utilities +20.34% YTD, Energy +11.99% YTD, Materials +11.57% YTD, Industrials +8.69% YTD, Consumer staples +8.03% YTD, and Information technology +6.55% YTD.
Underperforming Sectors: Healthcare +4.39% YTD, Consumer discretionary +4.31% YTD, and Financials –0.90%
YTD. |